

The bar is set pretty high around here, but there are definitely some awesome data products we've come across and thought we would share.
So, what makes a great data product? For Juice a great data product or application meets the following criteria:
- Delivers valuable data to consumers or non-analytical users.
- Displays presentation quality information vs. a four quadrant dashboard.
- Offers interactivity and a way for the user to engage with the data.
- Guides users through the information and does a great job with data storytelling.
- The product uses data to drive revenue or retention.
The following are our favorite, non-Juice created, data products in the market today. Let us know at info@juiceanalytics.com of any that we're missing that meet these criteria.
Five Thirty Eight (fivethirtyeight.com)
These guys have really grown on us, especially in the recent months. They do a great job of wrapping data into a story. Their data storytelling skills are well developed. In the example below we value how they give color meaning and make labels easy to understand. Annotations and text descriptions are definitely where many data products are lacking.

True Car
We really like the way True Car applies guidance to the user experience. It's very clear what actions the user should take. The interactivity of the histogram as well as the animations applied reveal the impact of the selected changes in a clear way. Note how the simple use of the numbers going left to right make it so that a first time user knows example how to use the application and consume the information. Also, the use of action words like See, View and Get are subtle, but give an added layer of clarity.

Payscale (www.payscale.com)
While Payscale, a salary comparison application, isn't as true(car) to the Juice Design Principles as we'd hope, there are some items they've done well. We love when charts are labeled using questions. See below how they use questions to describe what the charts are trying to answer. The user doesn't have try to interpret what is being conveyed. They know right away.

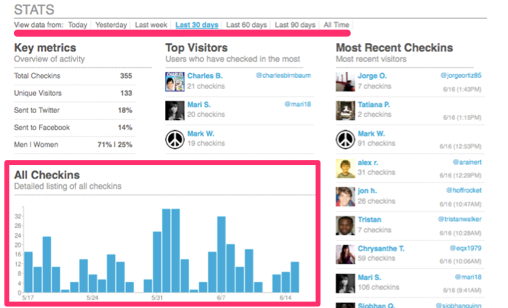
Foursquare Analytics (foursquare.com)
The Foursquare team offers this interface for customers to understand their user traffic. There's lots of information to convey, but their focus on filters at the top and modular design really make it easy for the user to focus their attention on a specific data set. I did crop the 3D pie chart from this display. It took away from a pretty valuable application.
To get more details on what makes a great data product, check out the case studies found throughout the solution pages but specifically at the bottom of the Healthcare page for case studies on Healthstream and Laerdal.