
Juicebox delivers…
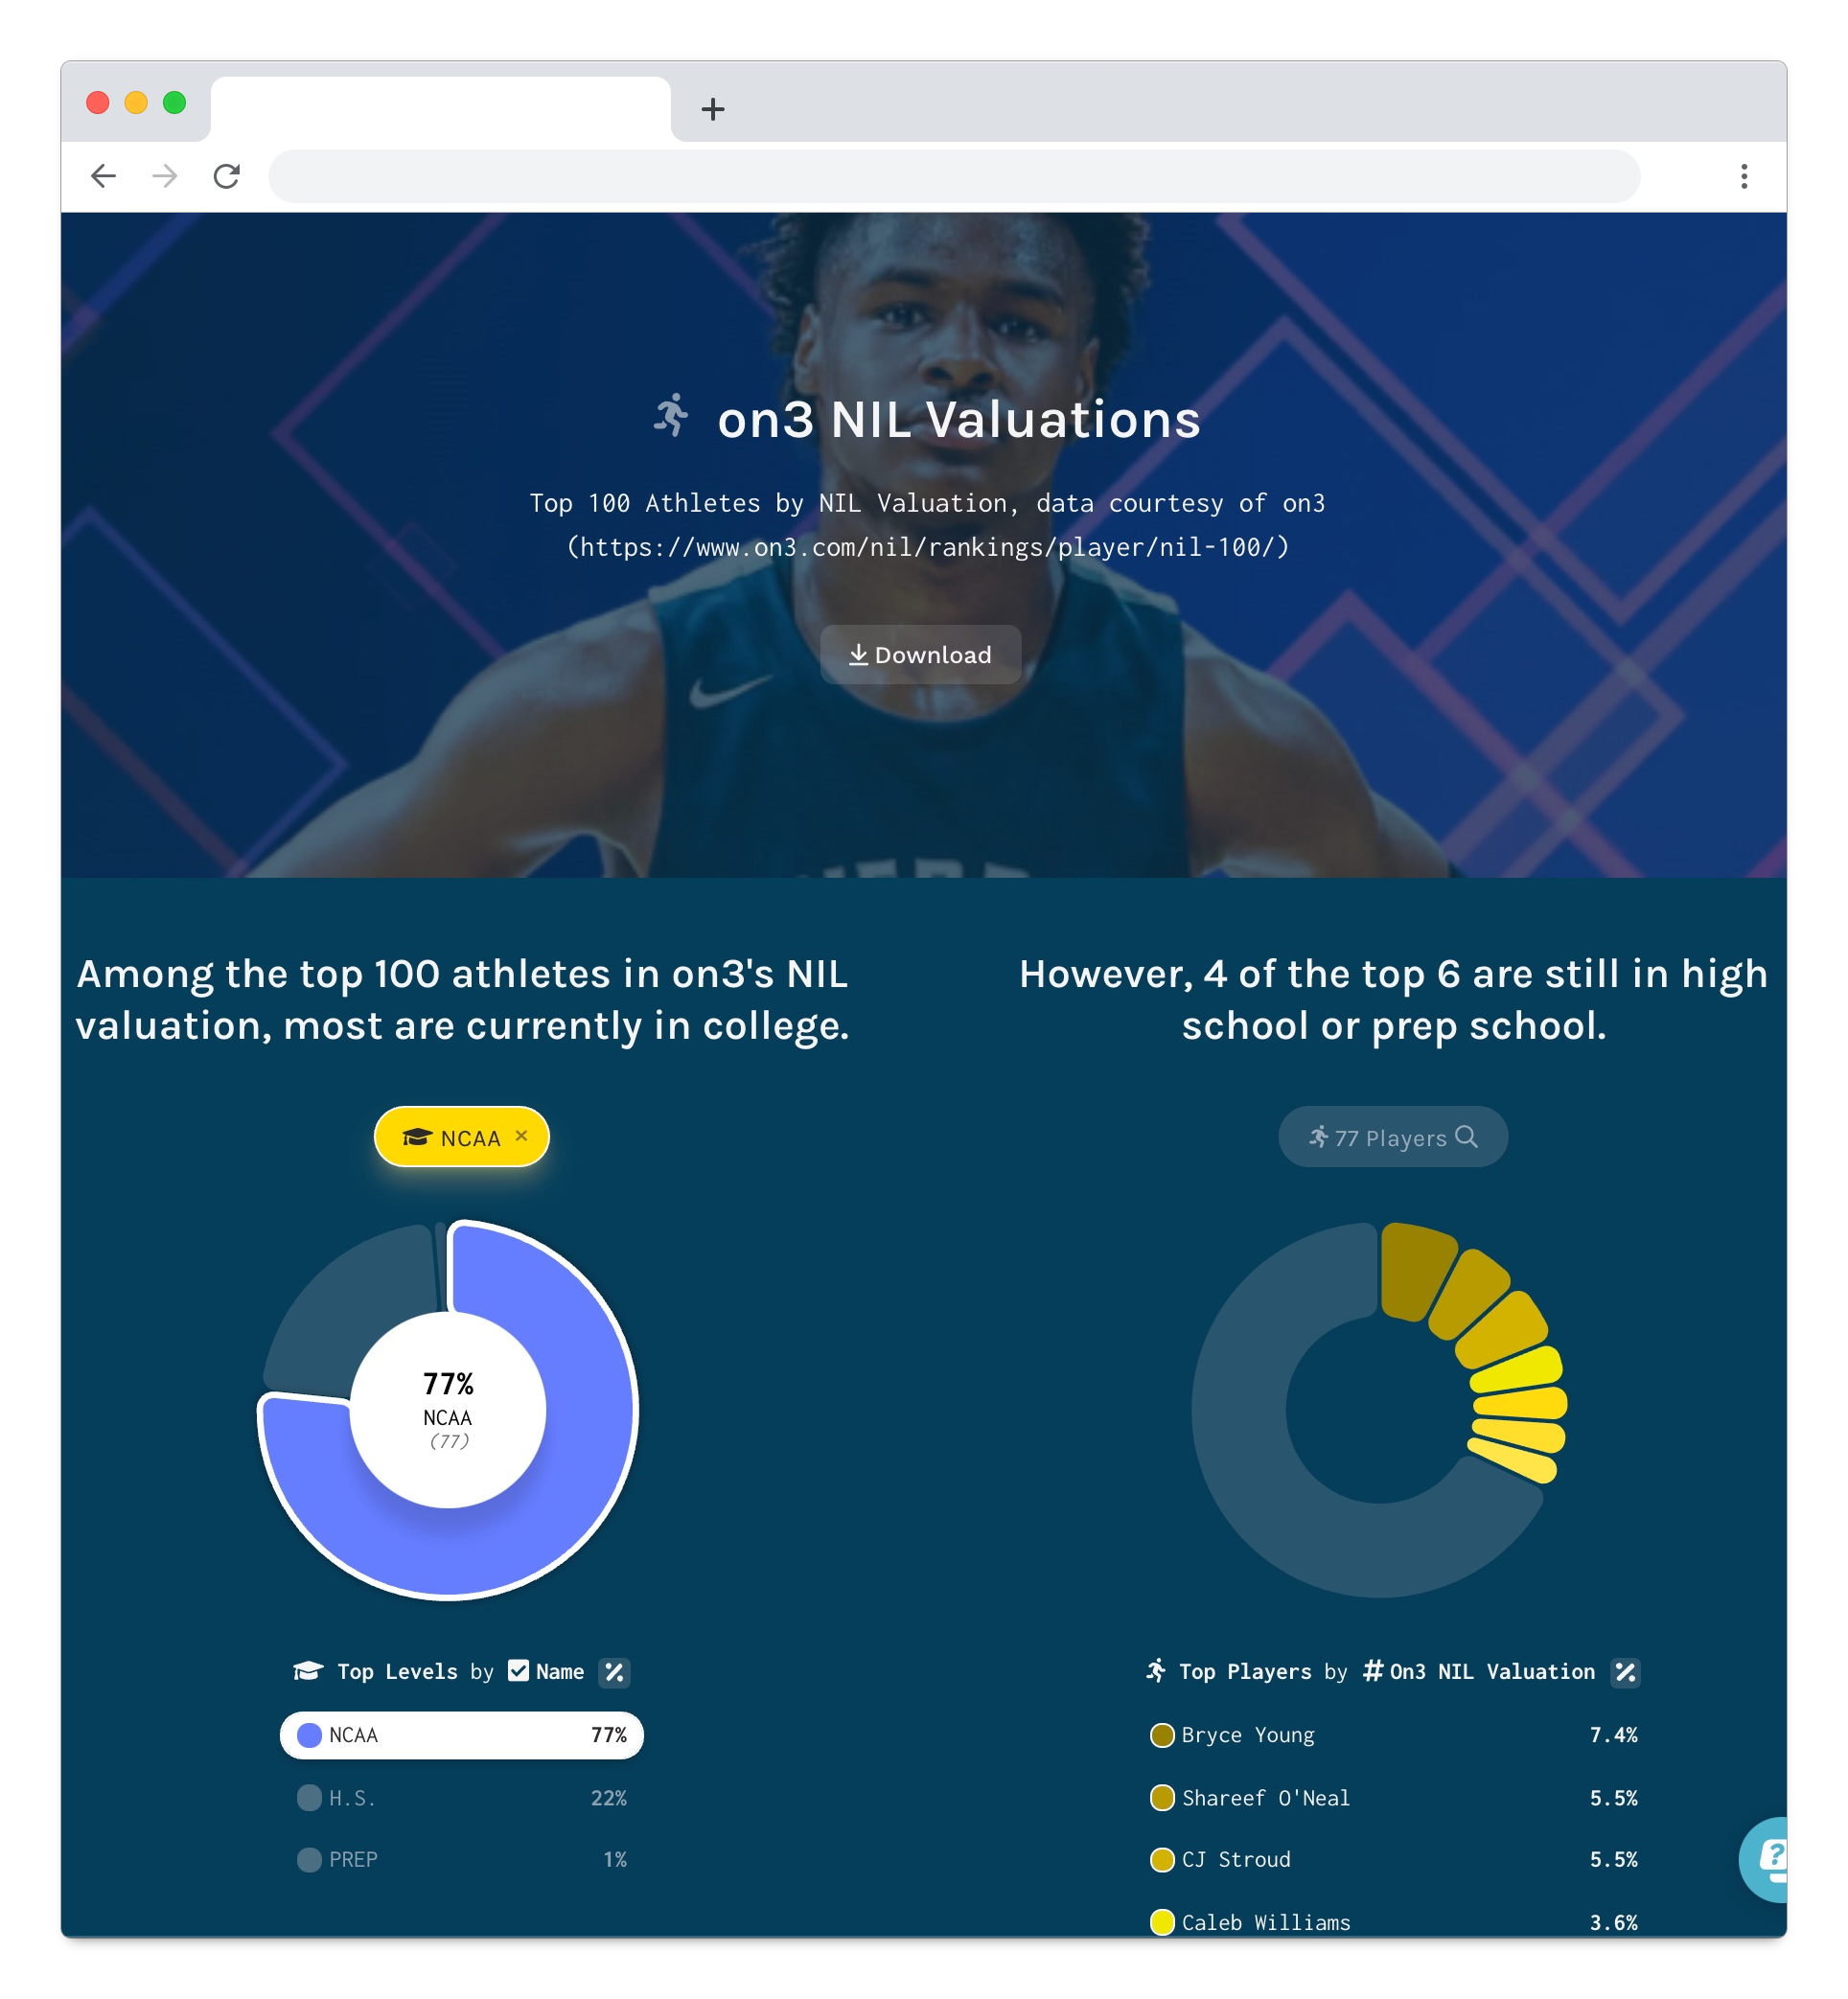
Your Message as an Interactive Infographic
Tell your story in a powerful format that combines data, images, and text narrative.
Juicebox makes it easy for anyone to create beautiful, interactive infographics that can be shared as a webpage.
See an example here.
Beautiful web design without expensive resources

Seamlessly combine text, images, & data visualization

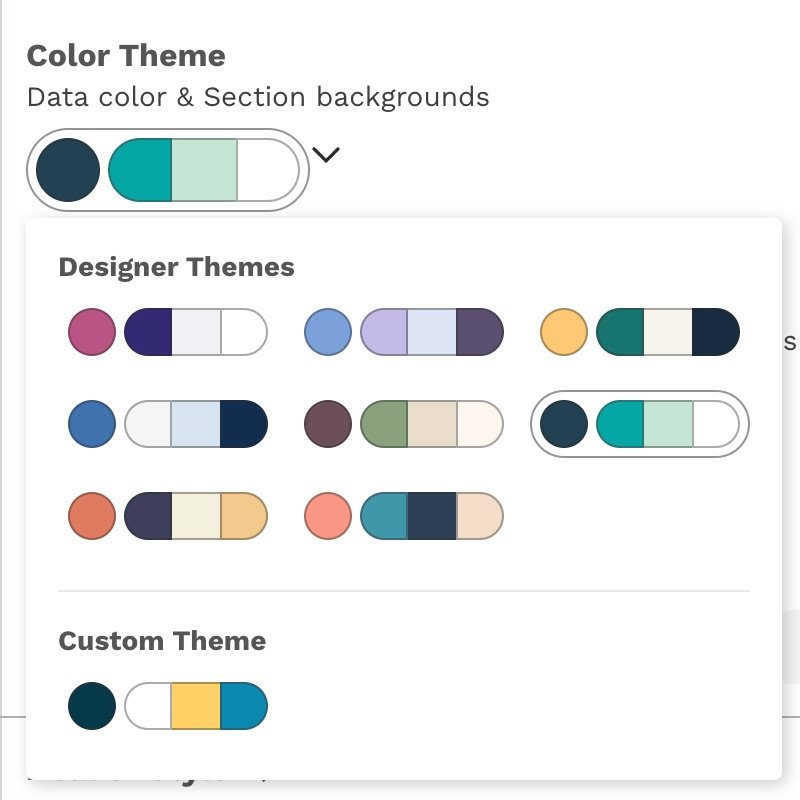
Customize your infographic to fit your brand guidelines
Why Juicebox for Infographics?
Infographics and data visualizations are 2 of the 3 most popular visual formats for marketers (Venngage)
67% of B2B marketers are creating and sharing infographics (Visme)
44% of marketers say creating infographics is difficult and time-consuming (Visme)
Who should consider Infographics?
PR and Marketing Agencies looking to reach target customers with a data-driven message.
Communications and Sales Leaders who want to influence conversations with customers.
Non-profit Leaders who want to demonstrate the impact of their mission-driven organizations.

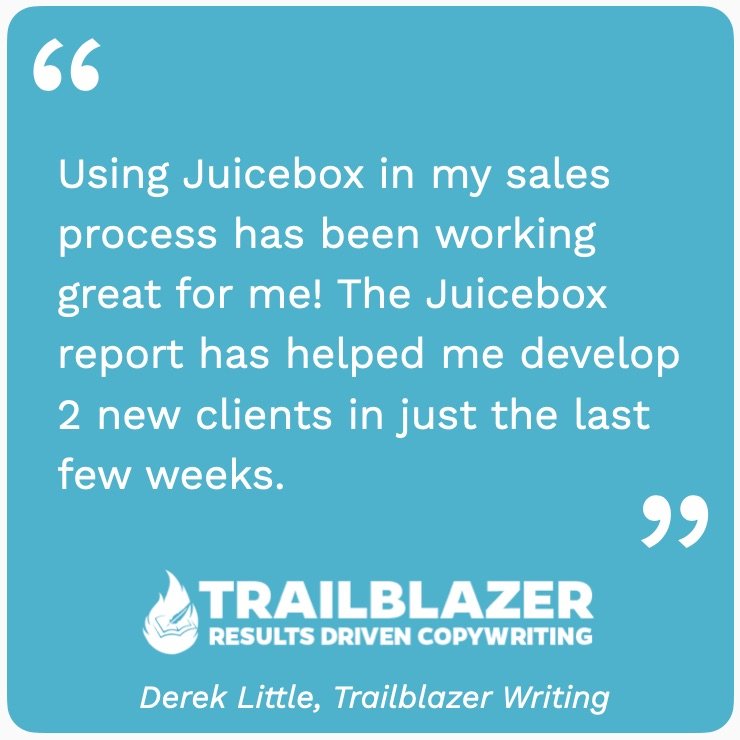
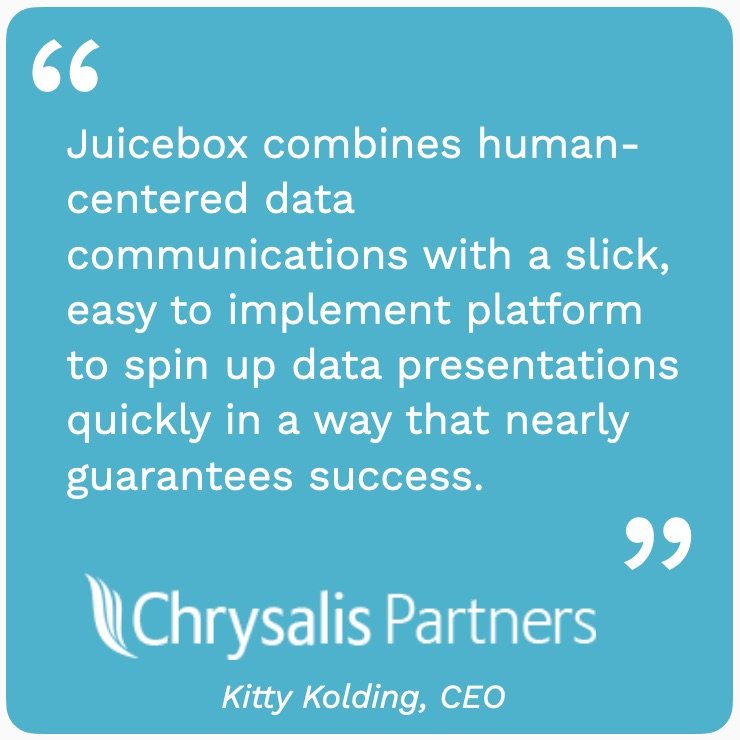
Our customers love how Juicebox combines ease of use with powerful outcomes:
The best choice for Diversity Reporting
No other tool combines data presentation, ease-of-use, and powerful analytical features.
🧭 Dynamic narratives to guide your audience to insights. Juicebox enables drill-down analysis and interactive data exploration automatically.

🎨 Built-in design so your data always looks professional. Now you can make beautiful apps that will impress your audience.
🌠Combining images, narrative text, and interactive visualizations delivers a complete data storytelling experience — not a collection of charts.

🏎Pre-build templates give you a jump-start on creating your perfect presentation, fast.
