
Juicebox delivers…

Diversity & Inclusion Reports.
Demonstrates your commitment to building a stronger organization through diversity transparency.
Juicebox provides a fast, affordable way to convert standard EEO-1 diversity data into a beautiful interactive website.
Pre-built template works with EEO-1 data

Explain your journey with word, images, and data

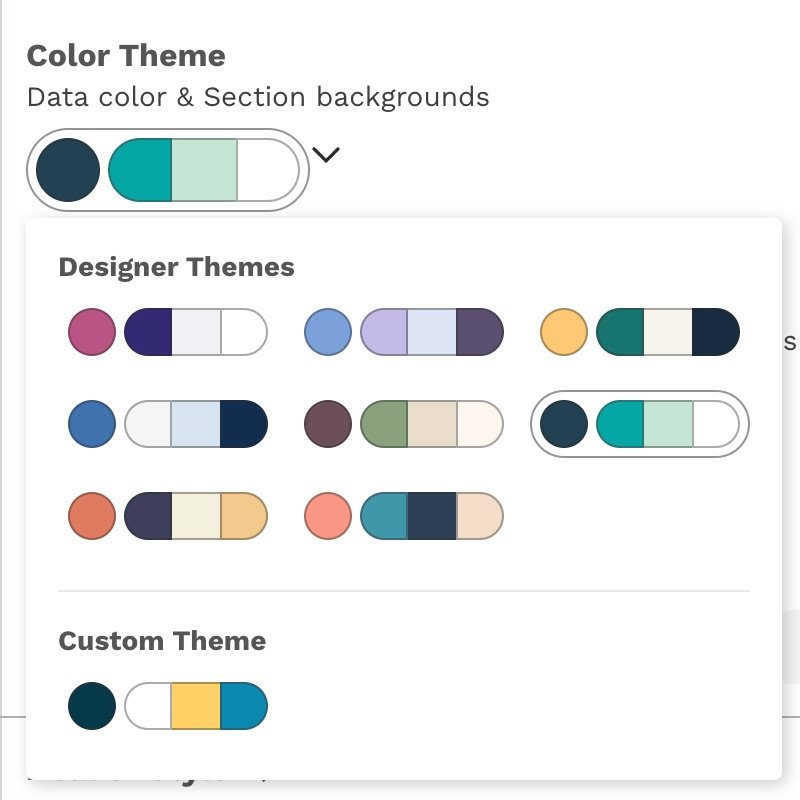
Customize your report to fit your brand guidelines
“A McKinsey study found that companies in the top quartile for gender diversity in corporate leadership had a 21% likelihood of outperforming bottom-quartile industry peers on profitability. Similarly, leaders in racial and ethnic diversity were 33% more likely to outperform peers on profitability.”
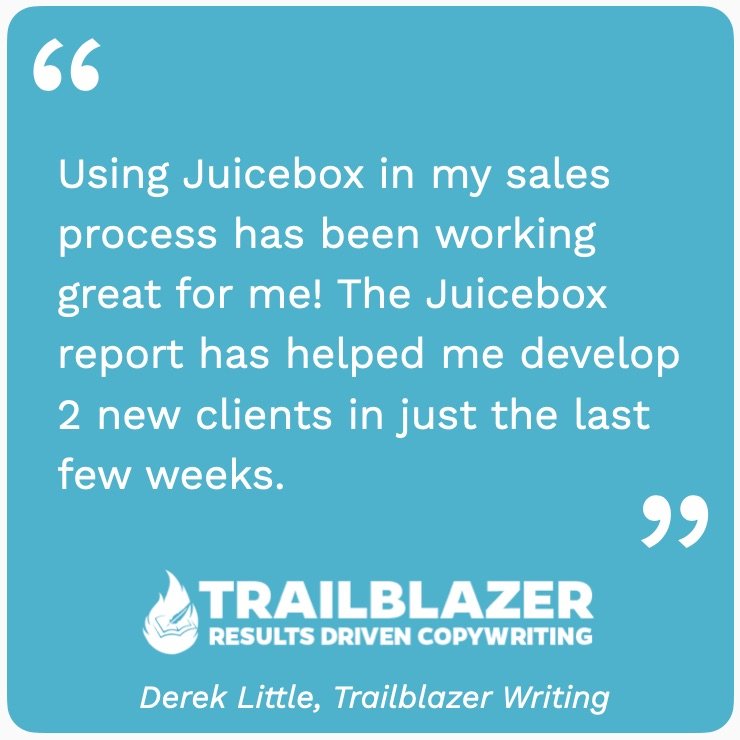
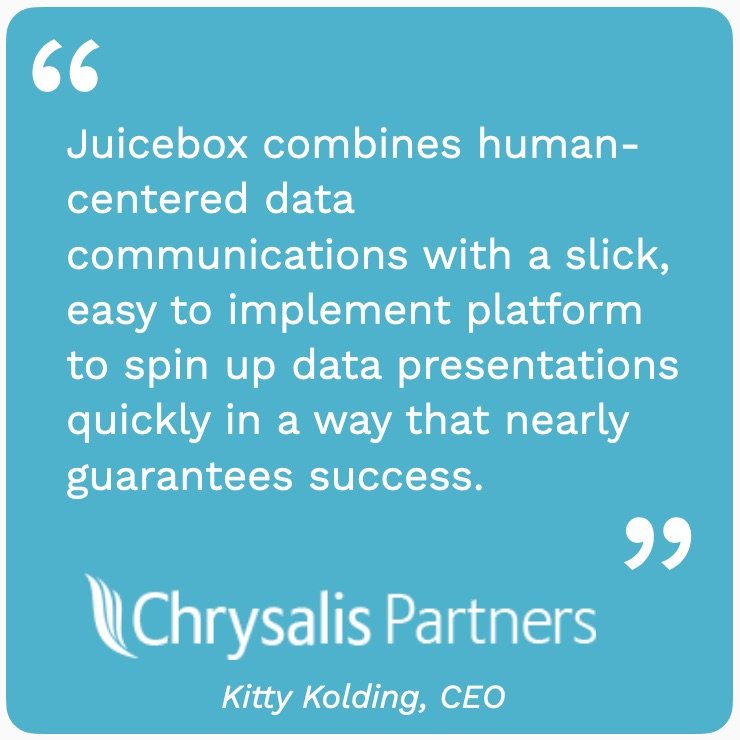
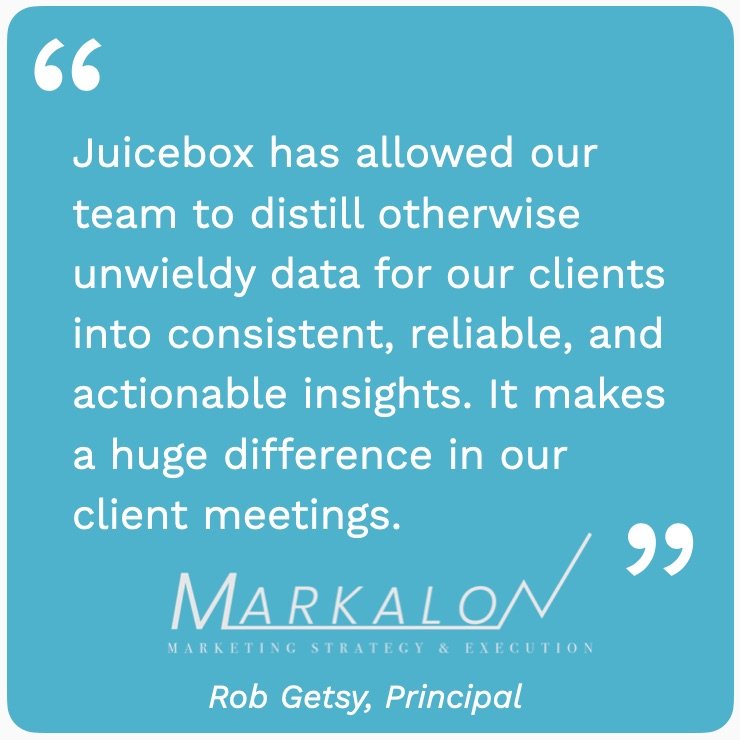
Our customers love how Juicebox combines ease of use with powerful outcomes:
The best choice for Diversity Reporting
No other tool combines data presentation, ease-of-use, and powerful analytical features.
🧭 Dynamic narratives to guide your audience to insights. Juicebox enables drill-down analysis and interactive data exploration automatically.

🎨 Built-in design so your data always looks professional. Now you can make beautiful apps that will impress your audience.
🌠Combining images, narrative text, and interactive visualizations delivers a complete data storytelling experience — not a collection of charts.

🏎Pre-build templates give you a jump-start on creating your perfect presentation, fast.
