Research

Reporting in Haiku

Over the last couple of weeks we’ve been running a survey to find out how people feel about reporting. In the survey, we asked respondents to provide three words that come to mind when you think of reporting. Semantic text analysis is great, but the best way I found to extract the essence of this question was through haiku. These are your words, rearranged.

We weren’t surprised to find that the role of the report creator isn't easy…

boring, tediousreports are one big hasslejust order taking

boring, tedious

reports are one big hassle

just order taking

The feelings dip into frustration...

puking facts lumped graphstheir expectations unmettoo cumbersome, stop

puking facts lumped graphs

their expectations unmet

too cumbersome, stop

Consumers of reports expressed their own concerns with the state of reporting…

designed for expertsunread columnar tablesgive too much detail

designed for experts

unread columnar tables

give too much detail

But we must not give up — there is so much potential for value...

old needle haystackurgent, accurate, pressureundervalued read

old needle haystack

urgent, accurate, pressure

undervalued read

We have a long tradition at Juice of expressing ourselves via haiku, and Chris’s one about Juice is still a wonderful summary of how we can help.

What are these numbers?

Sea of corporate data

Juice is your life raft

Why Build a Data-Savvy Culture?

In our book Data Fluency, we describe the four pillars of a “data fluent” organization:

Data_Fluency_Framework.png
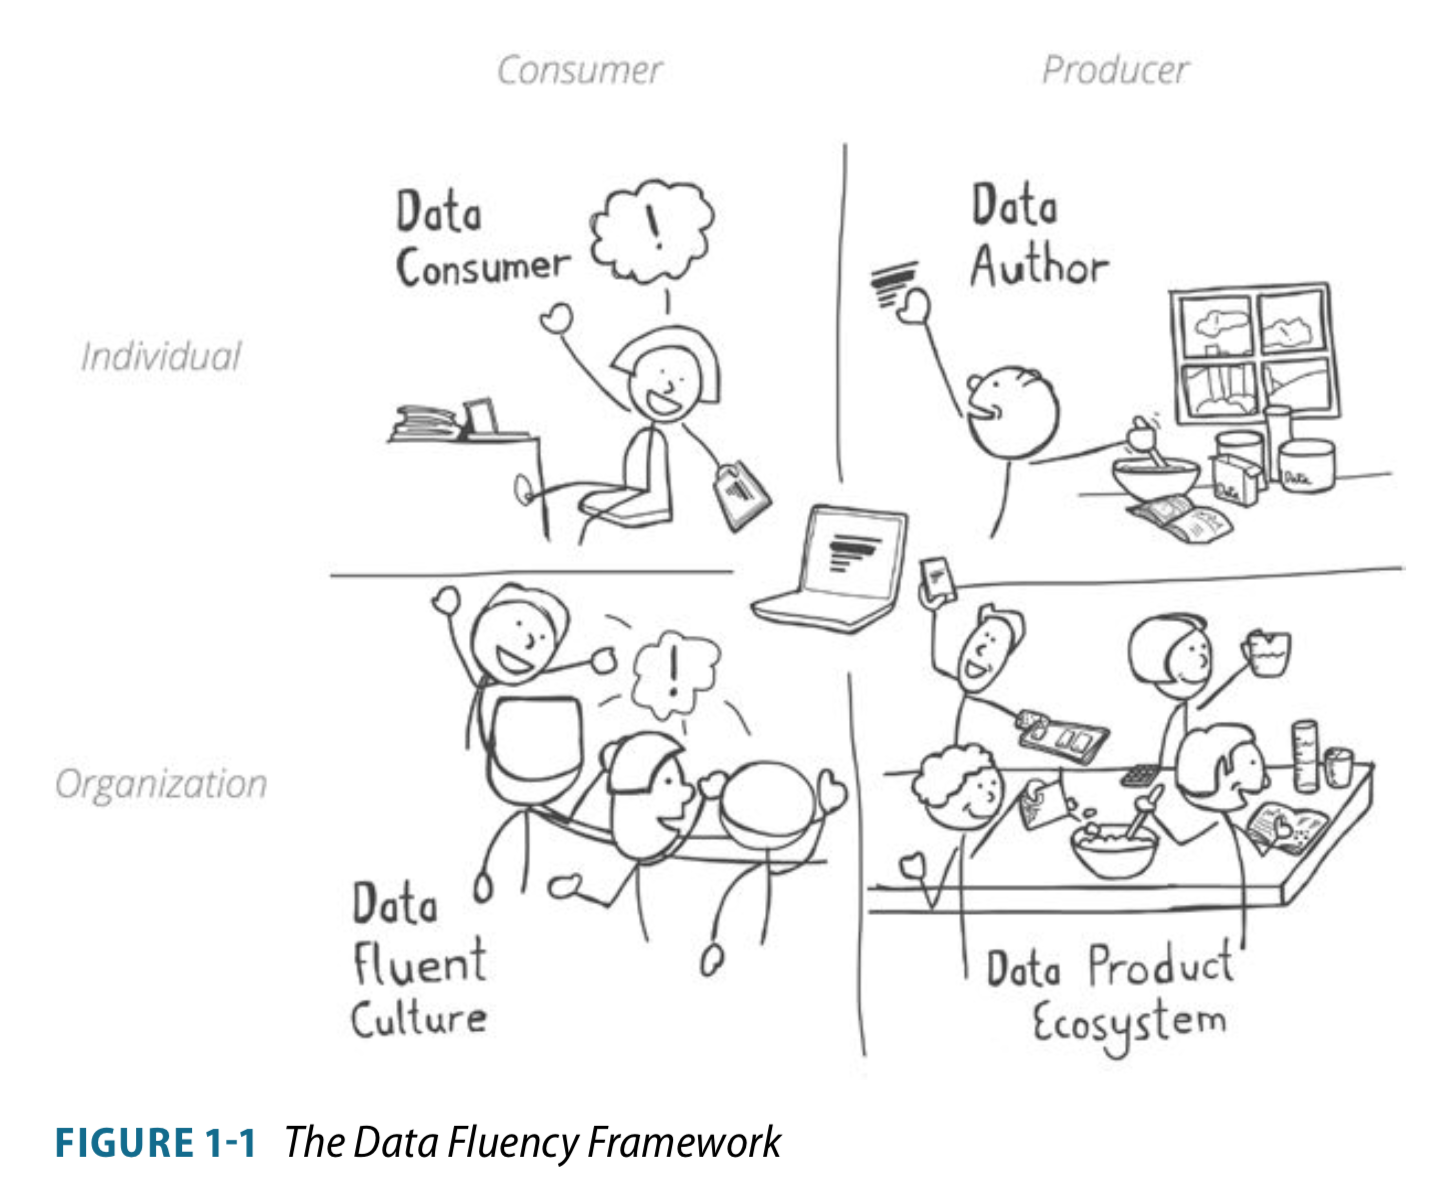
  1. Data Consumers — the people who use data products to make better decisions;

  2. Data Authors — the people who create data products to influence and inform decisions;

  3. Data Ecosystem — the set of tools, processes, and capabilities to create effective data products;

  4. Data Culture — the norms, expectations, and leadership that encourage a data-savvy organization.

Of these pillars, perhaps the most foundational and critical is the data culture. Research suggests that many organizations struggle to create this data culture and a healthy data culture is tied to overall performance.

What does the data say?

A recent article from the MIT Sloan Review (authored in part by Thomas ‘Competing on Analytics’ Davenport) summarizes survey results showing that many organizations lack an adequate data culture. Among the key data points:

  • Only 37% of those surveyed said they would describe their organizations as either “analytical companies” or “analytical competitors.” 

  • 67% percent of those surveyed (all senior managers or higher) said they are not comfortable accessing or using data from their tools and resources.

At Juice, we’ve been saying for over a decade that analytics is a social problem, not a technology problem. Another survey from NewVantage Partners underscores this point:

  • Only 7.5% of executives cite technology as the challenge to their data objectives;

  • 93% of respondents identify people and process issues as the obstacle.

But why is it so important to build a culture that supports and encourages data-informed decisions? The MIT Sloan research shows that companies with strong analytical cultures perform better:

  • Among the 37% of companies in the survey with the strongest analytical cultures, 48% significantly exceeded their business goals in the past 12 months.

  • In the 63% of companies that do not have as strong an analytics culture, only 22% significantly exceeded their business goals.

Where to next?

If a data culture was something you could purchase, the companies answering these surveys would have done so. Most large organizations are investing heavily in data science, AI, data infrastructure, master data management, and analytical tools (we can save you money there). Culture isn’t the result of a budget line item; it comes from top-level leadership and a long-time persistence.

Here are a few of the places to start.

Executive support. From the board and CEO to leaders in HR and marketing, top-level commitment to bringing data into the decision process will set organizational expectations and provide the necessary resource commitments. 

Modeling behavior. Actions speak louder than words. When leaders throughout the organization show data-savvy behavior, like incorporating key metrics into status meetings or championing a new dashboard, everyone will get the message. 

Building habits. Changing behaviors is hard for anyone. It requires a lot of enabling factors including culture, convenience, confidence, and visible impact. Putting these elements in place for your organization is the hard work required to create new habits of thinking.

Ask us about our new workshop to kick-start your data communication skills and plan a path forward toward a data-savvy culture.

Research Admin Survey Says...

A few weeks back, we surveyed university research administrators to get a better feel for their reporting practices and the types of tools they that use to communicate. Take a look at the results, and share in the comments below what surprised you most about the findings.

The survey results offer a glimpse into the Office of Sponsored Research's reporting process, effort and current tools. The survey results are from 84 different U.S. universities and 2 private research facilities compiled in the first quarter of 2016. They are a mix of 40% Public and 60% Private institutions.

Video: 10 Design Tips for Better Reporting

Often when sharing and presenting data, things can easily get lost in translation. The reason for this typically comes down to the way the information is displayed. This disconnect is easily prevented, however, by incorporating a few easy design techniques into your reports and presentations.

In this video, we go through ten tips and ideas for improving chart and presentation understanding. Watch below, or check out the slides on SlideShare, and let us know what your favorite presentation tips are.  

Demo of Self Service Reporting for Offices of Sponsored Research

Research universities administer hundreds of research proposals and awards.  As a result, research administrators receive a comparable number of report requests on proposals, awards, expenditures and researchers.   While electronic research administration (ERA) systems have great data and offer reporting, these systems don't always make data easily available or in an easy to consume format for college leaders and sponsors.  As a result, there's a lot of effort spent packaging the data and making reports more presentable.

Here's a brief video (< 1 minute) showing what Research Self Service Reporting powered by Juicebox looks like and how it engages users.

Like what you see of the Research Self Service Reporting?


Self Service Reporting of Research Activity for Campus Leaders

Here's a recent webinar with Notre Dame's Office of Research sharing and discussing how they're using the Juicebox platform to implement self service reporting and automate their sharing of information with campus leaders.

A 30 minute webinar of Notre Dame's Director of Business Intelligence, Terri Hall, describing how they use Juicebox to provide self-service reporting to their users.

To learn more about Notre Dame's implementation of Juicebox, download the case study.