analytics

5 Phases of Data Analytics Maturation

Recently, while meeting with one of our clients, they mentioned their desire to provide their customer’s business team with the ability to run ad-hoc reports. This notion spurred me to think about whether or not I thought this was a plan for success. Would having this additional analytics ability help the non-analyst be more effective at getting their job done? Over the next few days, we’ll be exploring the different stages of maturity that information workers go through as they try to become more effective and efficient at consuming and acting on information. By our reckoning, we figure there are 5 Phases in the maturation cycle:

  1. Phase 1: Tribal Elders

  2. Phase 2: Static Reports

  3. Phase 3: Bigger Static Reports

  4. Phase 4: Ad-hoc reports

  5. Phase 5: Experienced Guide

As we go through the different stages, we’ll discuss the breadth (how wide is coverage of all available information), depth (how deep is the understanding about covered information), reach (how easy is the access to the covered information), the typical user of the analytics method, and the signs that the organization is outgrowing each phase in the model. So, without further ado, let’s get started.

Data Analytics Maturation Phase 1: Tribal Elders

Answers from the Experts

The earliest stage of analytics maturity is one in which the organization relies entirely on the expertise of one or two individuals who use their business savvy to provide analytics. These folks, we’ll call them Tribal Elders, have been around the company for a long time and have "seen it all." Just like those "elders" in the movies, they’re wizened leaders who can mash all the data in their heads and join it with their experiences to make good decisions. In effect, there is no formal analytics that is performed during this stage. However, every day, the expert is using their training in the school of hard knocks to observe, analyze, act and advise on what they know to be the best for the business.

On the other hand: No rest for the weary

An organization outgrows this phase when the business becomes complex either through growth or through changing environment (such as variance in market conditions, or the expert leaving the business). All of a sudden, the leaders find themselves in a situation where they can’t scale the decision-making quickly enough to continue to drive the business. The huge asset of the expert’s experience has turned into a liability that acts as an anchor on the organization’s maneuverability.

Data Analytics Maturation Phase 2: Static Reports

Answers to questions you know

An organization has reached the second phase when they have realized that they have outgrown their ability to rely wholly on what they can get out of the Tribal Elders to run the company. So they start to write down all the questions they normally ask. They use this list to start to build reports that that can provide answers to those questions that they know. Once completed, the organization now has the ability to enable a broad audience to answer the questions that have been asked on a regular basis.

On the other hand: Surprise!

The limitation of this approach is that the Tribal Elders are still needed to answer the questions that fall outside of the standard "what I know to ask" category. The beginning of the end of this phase happens when an event that was unforeseen occurs that dramatically and negatively impacts performance. The logical question arises "why didn’t we see this coming?" followed by the answer "we didn’t have that data." The organization then begins the transition to Phase 3.

Data Analytics Maturation Phase 3: Bigger Static Reports

Answers to questions you don’t know

Once the organization realizes that they need answers to questions that they don’t yet know, they start to extract all sorts of permutations on all of the data that they have and distribute those reports to the "need to knows" on a regularly scheduled basis. In most cases, an analytics team is set up to manage the requests from the business for more or different information. Sometimes the reports are modified, but many times new reports are created because the users already know how to use the old reports. The analytics team works hard to maintain the information flow to the individual requests with the intent to provide all the information that would ever be needed by the consumers.

On the other hand: Page 73, Row 14, Column G

The downside is that this typically manifests itself in the form of the dreaded 124-page monthly report. So, the reporting "Oracle of Delphi" shows up in the inbox. For a little while, there’s some excitement along the lines of "I never knew we could get all this information." However, soon folks realize that interpreting the data for "questions you don’t know" turns out to be pretty difficult and once they figure out where are the answers to the questions they know, they just look at those few rows of the report and leave the rest for analysis "later" (which probably means it ends up in the recycle bin...if we’re lucky).

Data Analytics Maturation Phase 4: Ad-hoc reports

Answer your own questions

Phase 4 begins when a few folks who get the 124-page data dump realize "if I could just filter the data down a little I could much better understand the answers to this specific question". The organization provides the ability for end-users to create ad-hoc reports. Now the user has the ability to construct their own custom reports to answer the specific and unique questions they have about their data.

On the other hand: Water, water everywhere...

Sadly enough, however, most people who need to know the answers get stuck in any of a few traps down in the weeds. The first trap is that they may be sure they know what questions to ask, but even in spite of their confidence, they’re really asking the wrong ones. Secondly, most people in this situation are more business-oriented and less technical (presumably the more technical ones have already figured out how to query the data directly). In all but a few cases, the tool that is provided requires too much technical expertise for most business people to overcome in order to be really productive. Thirdly, even if they can actually get to the data that really does help them to be more productive, they lack the analytical expertise to interpret the data and turn it into usable information. The end result of these three hurdles is that the users end up either in analysis paralysis, or just plain giving up.

Data Analytics Maturation Phase 5: Experienced Guide

Answers to questions you should know

To solve the barriers presented by having a lot of data available only to technical users, maturing organizations provide solutions targeted at specific business areas that make exploration accessible to those who can impact business performance (in other words, everyone involved in the workflow). These solutions are not about the technology or even the data, but rather about providing information that translates easily into getting stuff done.

The results are provided in a fashion that makes access to the right information easy by guiding the user through a process to help them answer the known questions, discover new questions to ask and explore answers to these questions. It’s sort of like the guide you might hire on a photo safari. The experienced guide will make sure you find the animals that you came to see in the first place, but will also point out really interesting things along the way that you had never thought of. And you might even discover something amazing and exciting that you didn’t even know existed. Good information tools are just like an experienced safari guide.

On the other hand: Few and far between

The sad part about "experienced guide" information tools is that there are so few that exist. The good news is that we see more and more information workers and decision-makers "seeing the light" when it comes to understanding their need for these sorts of tools. And, we believe that as more and more organizations mature and experience the challenges of the first 4 Phases of Analytics Maturation that more and more will see the benefits of Phase 5, and implement solutions that help us all be more effective and efficient users of information.

The Rise of Analytical Apps — Are We Seeing the Last Days of Dashboards and Reports?

dinosaur_comic.png

66,038,000 years ago, a massive asteroid smashed into the earth in what is now Mexico's Yucatan Peninsula. After this massive collision, it took only 33,000 years before the dinosaurs were entirely extinct — a blink of an eye in terms of the history of the earth.

This asteroid is considered to be the "final blow" after a series of ecosystem changes (other asteroids, volcanos, etc.) created a fragile environment for the poor dinosaurs. The climate changed, the dinosaurs died out, and the mammals took over.

Incumbent solutions for delivering data —dashboard and reporting tools— are facing their own "fragile environment." The big asteroid may not have hit yet, but it is only a matter of time. Here's why.

Exhibit A:

A thoughtful answer from an experienced Tableau user to the question “Why do people still use Tableau?”

We need to consider why (and when) people might stop using Tableau. My opinion is that Tableau has failed to realise two important things about their software and that if another company can solve this problem then Tableau could really lose out:

1. Companies need to create applications, not just reports

Yes, Tableau is interactive but you cannot use Tableau to make applications that write back to a database. It has maps, yes.. But you cannot use Tableau as the basis for an app like you might with MapBox (which has multiple SDKs for different platforms) or Leaflet.js for instance. Tableau is not designed for this, so if you need apps and not reports then it is not for you. You need a developer (or dev team) instead. This is a big gap in the product that other companies are also failing to see.

2. Tableau’s software does not directly generate revenue for (the majority) of their users

For a company to run several copies of Tableau desktop costs several thousand pounds. This is without the additional costs of Tableau Server or end-user licenses that you will need if you want your customers to use your hosted visualisations and dashboards. Any business that chooses to use Tableau to deliver interactive reports to its customers would need to consider passing some of that cost (or all of it) onto its end users. But when we’re talking about interactive reports, not applications, it is hard to justify data reporting as a stand-alone or additional cost.

That’s a real user wondering whether the paradigm of visual analytics tools for analysts, dashboards for executives, and reports delivered to customers and stakeholders is going to hold up for much longer.

Exhibit B:

Analytics vendors and market analysts are using language that leans more toward delivering "apps." 

Alteryx

Alteryx

PwC analytical app marketplace

PwC analytical app marketplace

Infor

Infor

Gartner's IT Glossary

Gartner's IT Glossary

IBM Cognos

IBM Cognos

Is “app” more than a rebranding of a decade of data visualization tools? We think so. Here’s why we see analytical apps are on the way to taking over the BI world:

1. Apps have a purpose. A report or dashboard may carry a title, but it is less common that they have a clear and specific purpose. A well-conceived analytical app knows the problem it is trying to solve and what data is necessary to solve it. In this way they are similar to the apps on your phone — they solve a problem the same way a mapping app shows you how to get to the Chuck E. Cheese and a weather app lets you know if you need to bring an umbrella.

2. Apps make data exploration easy. I’ve spent a decade railing against poorly designed dashboards that put the burden on users to find where to start, how to traverse the data, and what actions to take. Good analytics apps willingly carry that burden. Whether we call it “data storytelling,” narrative flow, or quality user experience design, the app should deliver a useful path through the data to make smart decisions.

3. Apps are collaborative. Most business decisions are made as a group. If that weren’t the case, you’d have a lot fewer meetings on your calendar. Why should data-driven decisions be any different? Historically, reports and dashboards treat data delivery as a broadcast medium — a one-way flow of information to a broad audience. But that’s just the start: the recipients need to explore, understand, and find and share insights. They should bring their own context to a discussion, then decisions should be made. Our belief is that data analysis should be more social than solitary. It is at the heart of the “discussions" feature built into our data storytelling platform, Juicebox.

4. Apps lead to action. "What would you do if you knew that information?” That’s the question we ask again and again in working with companies that want to make data useful. Understanding the connection between data and action creates a higher expectation of your data. Analytical apps connect the dots from data to exploration to insight to action.

5. Apps are personalized and role-specific. The attitude of "one size fits all" is typically applied when creating a dashboard or report, and then it is up to individuals to find their own meaning. Analytical apps strive to deliver the right information for each person. How? By utilizing permissions for a user to only see certain data, automatically saving views of the data, and presenting content relevant to the user’s role.

The mammals took over because conditions changed, and the outdated species — with its size and sharp teeth — couldn’t adapt. Expectations are changing the analytics world. Consumers of data want an experience like they enjoy on their mobile devices. They don’t have the attention to pour over a bulky, unfocused spreadsheet, and they expect the ability collaborate with their remote peers. The climate has changed, and so too must our approach to delivering data.

If you’re still churning out reports, we can help you do better. Or if you’ve constructed a one-page dashboard, we can show you a different approach. Drop us a line at info@juiceanalytics.com or send us a message using the form below.

Building Bridges from Academia to Business and Practice

Hey all – we have developed a great relationship with John Stasko, Associate Chair of the School of Interactive Computing program at Georgia Tech and the General Chair of the upcoming IEEE VIS 2013 conference. As we’ve talked with John, our conversations seem to always come around to the need for a tighter connection between academia and industry. As a result, we thought it’d be great to introduce John to our tribe through a guest post. Below are just some of the ways John is working to bring academia and industry together. Enjoy! 


Hello - I’m a professor at Georgia Tech and I’ve been working in the data visualization research area for over 20 years. My friends at Juice asked me to write a short guest blog entry providing perspectives from the academic data visualization community and exploring ways to foster more industry-academia collaboration. I’ve found that we don’t work together often enough, which is too bad because each side has a lot to offer to the other.

I personally have benefited from business collaborations in many ways. Since data visualization research is so problem-driven, industrial interaction provides an excellent way to learn about current problems and data challenges. In my graduate course on information visualization student teams design and implement semester-long data visualization projects. I encourage the teams to seek out real clients with data who want to understand it better. Some of the best projects over the years have resulted from topics suggested by colleagues working in industry. Additionally, I often employ guest lecturers such as the guys at Juice to come and speak with my students and provide their own insights about creating visualization solutions for clients.

I hope that in some ways my class is benefiting industry as well and helping to train the next generation of data visualization practitioners. Students learn about all the different visualization techniques and their particular strengths and limitations. They also get hands-on practice both designing visualizations for a variety of data sets and using current “best practice” tools and systems. The course has become a key piece of the Master’s degree in Human-Computer Interaction here at GT.

Another opportunity for interaction is academic research forums such as conferences and workshops. Coming up this October in Atlanta is IEEE VIS, the premier academic meeting for data visualization research. VIS consists of three conferences: Information Visualization (InfoVis), Visual Analytics Science & Technology (VAST), and Scientific Visualization (SciVis). Last fall, the meeting garnered over 1000 attendees for the first time.  VIS is an excellent forum to learn about the state of the art in data visualization research, see the latest systems from commercial vendors, and just rub elbows with like-minded friends and colleagues.  Recent papers at VIS presented tools such as Many Eyes and D3, introduced techniques such as Wordles and edge bundling, or just pondered topics such as storytelling and evaluation.  And the meeting has much more than just research papers – It also includes numerous workshops, tutorials, panels, and posters. This year for the first time we have added an “Industrial and Government Experiences Track”. This program is designed to highlight real world experiences designing, building, deploying and evaluating data visualizations. The presentation mode for this track will be posters on display throughout the meeting with multiple focused interaction sessions. Each submission should include a 2-page abstract about the project and a draft of the poster. They are due on June 27th.  More details about the track can be found on the meeting home page.

I hope to see many of you at VIS in October here in Atlanta!

Looking at Trees to Understand the Forest

David Simon (of The Wire fame) has sucked me into another brilliant television series with Generation Kill. It is the story of a Marine recon unit at the beginning of the Iraq war. At the heart of all the action, the seven-part miniseries offers an intimate and honest profiles of individual Marines.

The characters don’t so much displace stereotypes as reveal texture and insight about the unique qualities of individual Marines.

The series got me thinking once again about different ways to analyze data. Almost four years ago, I posted a couple blog posts (Part 1 and Part 2) making a case for analyzing and visualizing data at a granular level to uncover patterns and behaviors. Generation Kill is a case study in looking closely at the individual trees to understand the forest.

Analytics is a journey of exploration--a continuous series of iterations with the goal of deeper understanding based on better questions and more targeted analyses. Einstein said:

"To raise new questions, new possibilities, to regard old problems from a new angle, requires creative imagination and marks real advance in science."

How to arrive at new questions?

In the previous blog post, I described examples from online learning, credit cards usage, and football film study to show how granular analysis can spur new questions. I’ve stumbled across a series of new examples recently:

Surveys. Survey analysis is hard work--just ask Ken who recently presented results from Juice’s survey on the practice of information visualization in organizations. If a survey is mostly about understanding your audience, rolling up responses by questions can’t be the only approach (though it is the most common). Cross tabs ("displays the joint distribution of two or more variables") are one direction to go. Another approach is to look for people who share common characteristics or patterns in their responses.

Macrofocus’ SurveyVisualizer is the most innovative survey analysis tool I’ve seen and it emphasizes data at a granular level.

"All the analysis elements are always shown as grey lines in the background. This provides an overview of the ranges and spreads of the individual values for each node, and facilitates the detection of outliers." (from Visualization of Large-Scale Customer Satisfaction Surveys Using a Parallel Coordinate Tree)

Medical research. Research studies are conducted against carefully defined target and control populations with aggregate statistics across these populations required for conclusions. However, the ability to review the patterns of diagnoses and procedures at the individual patient-level can help test assumptions about the target population and refine the parameters of a study. Better model inputs; better results.

Speech analytics. Michel Guillet at Nexidia recently told me about their approach to speech data:

Nexidia’s speech analytics can mine thousands of hours of audio to categorize, correlate or spot trends. However, it is quite often in identifying and listening to a lone outlier that the application provides its most valuable insights. Some examples of outliers can be the very long call of a particular call type, the extremely abrupt one, the one with the most languages spoken or the one where no one is speaking at all. An outlier can change your hypotheses and put you in a different direction…perhaps a better one. Nexidia’s reporting and analysis tools offer many different methodologies including histograms, analysis of means charts and flexible filtration by meta-data to identify outliers in large amounts of data. In addition, Nexidia’s ad-hoc search functionality allows users to search an entire body of audio content at any time, which is often helpful to find the “smoking gun" or a single recording which can make or break an argument.

Of course you can’t be assured of a full or accurate picture when looking at granular data, but somewhere between standard aggregation-based analysis and granular views lies the truth.

The Best of Business Intelligence: Innovation at the Fringe

Enough complaining about the broken bits of Business Intelligence; it’s time to highlight the things that are good and right in the industry. Like most industries, the renewal and innovation occurs at the fringe, beyond the comfort zone of established vendors.

I’ve created five categories and a catch-all to capture the solutions and companies (not so much technologies) that are leading the next generation of Business Intelligence. The categories are:

  • Analyst tools
  • Dashboards
  • Targeted solutions
  • Open-source and free
  • Advanced visualizations
  • Other stuff

Naturally I’ve focused on areas of Juice expertise and focus -- not coincidentally, the places where we feel BI has neglected end-users. According to a study by the Business Application Research Center, BI end-user adoption sits at a lowly 8%.

I’m happy to take your suggestions (and update the post) for things I’ve missed in these categories or for entirely new categories.

Analyst tools

Tools that make it easy for analysts to pull data from multiple sources, analyze, visualize and share it.

Tableau dashboard

Winner: Tableau, the reigning king of visual analytics tools, has added more web-based functionality to allow for online sharing and collaboration.

Good Data dashboard

Runner-up: Good Data has arrived on the market with a web-first platform designed to democratize analytics. I had a chance to get a demo from the management team and was impressed with the ease of use and high-quality data presentation.

Dashboards

"A frequently updated analytical display that is clear and concise" (via a recent post)...and not likely to draw the rage of Stephen Few.

BonaVista Systems dashboard

Winner: BonaVista Systems wants to make Excel a "first choice dashboard tool." From the humble position of sparkline plug-in vendor, BonaVista has taken a leadership role in encouraging more effective dashboard design.

Runner-up (tie): Two BI companies, Qlikview and Microstrategy, seem to be following BonaVista’s lead. Unfortunately, they may only be dipping in a toe as I found just a couple examples that break from the traditional over-glossy, gauge-riddled dashboard interface.

Qlikview dashboard

Targeted solutions

Companies that serve a narrow slice of the BI world extremely well. The desire to be all things to all people has been an Achilles Heel of the BI industry. The general purpose BI platforms often prove too broad and too generic to serve the unique problems of specific industries or functional areas.

WSOD

Winner: Wall Street on Demand is a brilliant, below-the-radar provider of information solutions to the financial sector. Their sparse, articulate marketing text and few screenshots hint at a company that knows exactly what they do and deliver high-quality BI solutions. I wish I knew more.

Runner-up (multiple): The following are just a few companies that have focused on an industry or functional segment to deliver targeted BI solutions:

Open-source and free

(I know there is a difference.)

Pentaho

Winner: Pentaho offers an open-source end-to-end BI suite that is a competitive alternative to the big-guys. Of course, the implementation it isn’t necessarily cheap or easy.

Google Fusion Tables

Runner-up: If anything should scare the BI industry, it is the possibility of a Google Analytics model extended into more general data analysis and visualization tools. Google Fusion Tables may just be the tip of the iceberg.

Advanced visualizations

Bringing leading-edge visualization techniques out of academia and into the business world.

Many Eyes PhraseNet

Winner: Many Eyes continues to impress with high-quality visualizations. They are easy to create and clean in design and usability. Impress your boss with a slick visualization in your next presentation.

Runner-up (tie): Openviz / Advanced Visual Systems and Panopticon appear to be the two BI vendors battling it out for leadership in advanced visualization solutions. Unlike Many Eyes, these guys lack Tufte-esque sophistication in infoviz design. That said, there is a big difference between creating a one-off New York Times-quality visualization and delivering a toolset that is re-usable in many different situations.

Other stuff to be admired

Free charts with good default design. InetSoft’s Style Chart and Google Charts offer free, embeddable charts.

Jargon-free BI marketing. With few exceptions, BI web sites are densely populated with those awful stock-photography people sitting around conference tables (or worse, the ethnically-diverse V-formation marching at you) and meaningless business jargon and techno-babble. I really appreciate Blink Logic’s web site with its straight talk and clean, readable design.

Roam BI

Beyond the desktop. RoamBI has a great-looking iPhone application that is designed to "transform your data into insightful, interactive visualizations delivered to the iPhone." It makes the Oracle and Qlikview iPhone apps look old-school.

Breaking Free of the One-Page Dashboard Rule

Conventional wisdom says that an executive dashboard must fit on a single page or screen. The argument hinges on a pair of assertions about this constraint: it provides necessary discipline to focus on only the most critical information; and it enables the audience to see results "at a glance."

The "discipline" argument is made forcefully by Avinash Kaushik (among others).

"if your dashboard does not fit on one page, you have a report, not a dashboard...This rule is important because it encourages rigorous thought to be applied in selecting the golden dashboard metric."

I buy wholeheartedly into the value of constraints. However, defining a useful constraint as a "rule" assumes there is only one viable means to achieve the desired ends. Confining visual real estate is but one way to focus your thinking. There are others: How about limiting yourself to five key measures? How about demanding that a dashboard can be understood in 3 minutes by a new user? How about only presenting exceptions?

The argument that a one-page dashboard necessarily provides an view of your business "at a glance" is more self-deceiving. Well-known information-ista Stephen Few uses this rationale in his definition of a dashboard:

A visual display of the most important information needed to achieve one or more objectives; consolidated and arranged on a single screen so the information can be monitored at a glance. PDF

I check my speedometer "at a glance". I "glance" at a Heads-up Display (HUD) on a video game showing how much energy my character has remaining. These displays communicate but a single number that is already hovering on the corner of my consciousness. If we follow this advice literally, we’d show:

Assuming one page gives you quick, easy comprehension is like assuming all red cars are fast. That’s simply not true. It must be duly noted, however, that all red cars are cool.

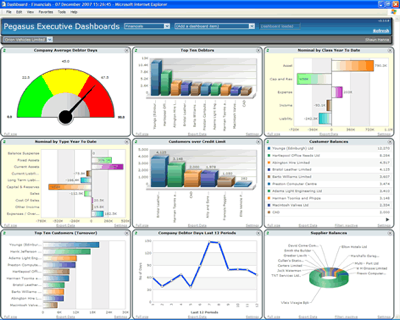
More often, people follow the one-page dashboard rule off a cliff like these folks.

executive_ dashboards.png

There are real problems with this definition:

dashboard_at_a_glance.png
  • In reality, the one-page rule leads to jamming information into the available space.

  • When everything must fit on a page, there isn’t room to describe the connections between information or fashion a story from the data.

  • A good dashboard raises more questions than it can answer. Sticking to a static piece of paper limits any ability to find or present explanations.

Don’t get me wrong: A one-page dashboard is often an effective way to create "a visual display of the most important information needed to achieve one or more objectives." But with streaming video, interactive visualizations, podcasts, Kindles, smart phones, video projectors...is it really necessary to limit ourselves to 8.5" x 11" piece of paper. Or might we open ourselves up to some more creative solutions to sharing the numbers; a short movie, a few slides, a short text narrative, or 140 characters.

I’d like to use this definition instead and will be back soon with some ideas on how to make your dashboards clear and concise.

Twitter Analytics for “Analytics”

Twitter’s wild popularity hasn’t obscured the fact that the service needs to eventually make money. The concept of “Twitter analytics” as a revenue stream has come up often enough to make my ears itch and my nose burn.

Twitter’s new business development lead explains that the company is “developing a range of analytics and metrics products and services built around the information contained in tweets”…and “trying to figure out what are the appropriate metrics around engagement and how to convey those.”

Web Strategist Jeremiah Owyang raises the concept of a Twitter CRM solution, in which Twitter would offer their own analytics system to brands, that will help them to track and manage the conversations.

The Twitter ecosystem has responded with a wide range of tools for analysis of Twitter data. Web analytics behemoth Omniture recently announced the integration of Twitter data into their platform. At the same time, web analytics consultant Eric T. Peterson has been vigorously marketing Twitalyzer, a tool to evaluate individuals’ use of Twitter and metrics of influence. Google’s Chrome Experiments released a cool visualization tool called Social Collider that reveals cross-connections between conversations on Twitter. Here are a few more Twitter analytics tools that I’ve run across:

Despite all the activity, I haven’t yet seen a solution that offers the kind of valuable analytics that a company could use to understand the Twitter conversation relevant to their business. The applications above are either focused on the measurement of individual Twitter users or offer a high-level tracking of words and phases in the general conversation. They treat tweets as transactions — How many? How valuable? Who’s listening? Who’s responding?

To me, the great and more rewarding challenge in Twitter analytics is to synthesize the substance of those conversations. Imagine if you went to a party and could overhear everything that everyone else was saying. Who talked the most and who had the greatest audience is less interesting than what topics people were discussing and what was said.

I wanted to take a shot at this type of Twitter analytics.

Analysis Approach

First I had to define a particular domain or topic area. For expediency, I focused on all the tweets that included the word “analytics.” Using the Twitter search API, I pulled the first 500 tweets for each day in March and parsed the results to pull out users, urls, and other characteristics of the tweets.

To analyze the words and phrases being used, I uploaded the resulting 11,300 tweets into Concentrate, our search analytics tool. Concentrate is optimized for search query text (i.e. short phrases without a lot of punctuation). Nevertheless, it has a number of features that make text analysis easier, including breaking out the most common words, phrases and patterns. It also allows for filtering by words to create frequency statistics.

There were two main questions I wanted to address:

  1. What topics are people discussing?
  2. What is the structure of the conversation?

Topics of Conversation

The content of the Twitter conversation can be analyzed as words, sites/links, people/groups, and company/products.

Words

I used Concentrate to find the most common words, then I dumped those words into Many Eyes to create this “Wordle-brand” word cloud. Many Eyes has a nice feature that takes out the “common English words.” Clearly Google dominates the conversation, and I even had to artificially reduced the value to make the other words legible.

Word cloud

Below are the top 10 (non-common) words that show up in the analytics conversation

Top words

Sites and Links

Twitter has become a mechanism for sharing interesting links (I’ll get to data on that in a bit). Looking at the most popular sites and specific links gives a sense for what people in this community are reading and talking about.

Top sites and links

People and Groups

Twitter users have a few conventions for connecting tweets to people or groups:

  • ”#” (i.e. hashtag) associates the message with associated with a group, topic or event.
  • “RT” (or “via”) is to repeat or “retweet” something someone else has said.
  • ”@” associates a tweet with another user, whether retweeting their message or directing a comment to them.

Here are the most common groups and people referenced in the Twitter data.

Top people and groups

And the people with the most tweets using the word “analytics”

Top talkers

Companies and Products

I was also interested in what companies or products were referred to most frequently. It is no surprise that Google dominates the conversation. Microsoft gets on the board with the recently closing of their adCenter product. I think we can safely assume they won’t be showing up that often in the future.

Top companies

Conversation Structure

Beyond the specific content of the conversation, I was also curious about how people who are talking about analytics tend to use Twitter.

Types of Tweets

Eric T. Peterson has four things he considers “signal” (versus “noise”) in the Twitter conversation:

  • References to other people (defined by the use of “@” followed by text)
  • Links to URLs you can visit (defined by the use of “http://” followed by text)
  • Hashtags you can explore and participate with (defined by the use of “#” followed by text)
  • Retweets of other people, passing along information (defined by the use of “rt”, “r/t/”, “retweet” or “via”)

While I’m not fond of this definition, examining these different types of tweets (along with question-based tweets) provides a good lens into the nature of the conversation. The following chart shows the percentage of tweets that fall into each of those categories.

Tweet Types

It would be all the more interesting if you could follow the types of tweets across time and compare against other topic areas. I suspect that the URL linking within Twitter is on the rise and is turning Twitter into a Delicious-style bookmark sharing service — without the functionality to save, tag, annotate, and view the bookmarks at your leisure.

Link Evolution

Given all the sharing of links, I wanted to get a clearer picture of what happens when a link becomes popular. The graphic below shows some of the top links during the month and the amount they showed up in tweets by day. The red bars represent days where ten or more tweets included the link. A couple links demonstrated popularity over a week or so, but the rest sizzled then disappeared in a day or two.

Link Evolution

Activity Distribution

Finally, I took a look at the distribution of users by the number of tweets including the word “analytics.” It was no surprise that the vast majority of the 7,700 twitterers only used the word once in March (of course this doesn’t tell us about their other twittering activity). Obviously there is a small population of people at the core of the discussion.

Activity Distribution

While you’d have to go into more depth to answer detailed questions, there are a number of interesting take-aways for me, including:

  • “Analytics” means “web analytics”, not business intelligence or general reporting about sales, operations, or marketing.
  • Google Analytics is the star of the party. Of course, the fact that the brand name includes "analytics" is an advantage, but I didn’t see a giant "Juice" in the word cloud.
  • Twitter is an echo-chamber. The content clusters around particular subjects, with people retweeting and sharing links about the big news of the day. There are a dozen or so stories that dominated the conversation over this time period.

What’s next?

There are a lot more views of this data that could be enlightening for a company interested having a real-time understanding of their marketplace. For example, it would be interesting to provide more insight into:

  • Who is at the center of these conversations?
  • What is the positive or negative tone of the discussion (Twitter actually offers this information as part of their API)?
  • How has is the conversation changing over time?
  • What is the best way to define the boundaries of a domain-specific conversation?

These are the types of questions that I’d like to see addressed in a more complete Twitter analytics tool.

Search Competition Among Travel Sites

This is a follow up to "Target Long Tail Searches with Keyword Patterns"

To get a sense of the scale of the long tail in search, Dustin Woodard recently put together an analysis of U.S. search data collected by Hitwise over a 3 month period, during which they measured 14 million different search terms. How did these break down?

  • Top 100 terms: 5.7% of the all search traffic
  • Top 500 terms: 8.9% of the all search traffic
  • Top 1,000 terms: 10.6% of the all search traffic
  • Top 10,000 terms: 18.5% of the all search traffic

This means if you had a monopoly over the top 1,000 search terms across all search engines (which is impossible), you’d still be missing out on 89.4% of all search traffic. There’s so much traffic in the tail it is hard to even comprehend. To illustrate, if search were represented by a tiny lizard with a one-inch head, the tail of that lizard would stretch for 221 miles.

Yesterday, we described the concept of search patterns and how you can use them to summarize this type of long tail text data. Today, we will walk through a case study we put together to explain how Concentrate’s pattern discovery feature will help you find new competitive insights.

You can replicate this study yourself by signing up for the Plus version of Concentrate and loading competitive search data from providers like Hitwise, Compete, Keyword Discovery, or comScore. The input search data used in our analysis consisted of a sample of unique queries leading to clicks on top travel domains during Spring 2006, along with their frequency of occurrence (the chart is truncated after the 20th query):

Raw search data: most frequent queries by site
unique search queries for travel sites

We loaded the full dataset of queries into Concentrate to generate summary patterns for each of 5 top travel sites. After each file of unique queries and associated metrics is loaded, the application generates reports which include summary statistics based on the head (top 50) and tail queries for each site. This is a good way to start looking at the data if we want to get a sense of each site’s long tail search strategy:

Head vs. tail queries for top travel sites

head vs tail for travel searches

It appears that the long tail makes up the overwhelming majority of traffic for the travel planning and review sites, but is a much smaller percentage for transaction focused sites like Expedia and Travelocity. Measuring the size of the head and tail gives us a rough idea what is going on, but we need to dig deeper if we want to benchmark where we stand in various categories and produce actionable insights. Inspired by a recent New York Times infographic "Words They Used", our data visualization guru, Chris Gemignani, downloaded the Pattern CSV file that Concentrate generated for each of these sites and created the following view of competition in the travel search sector:

Comparing travel searches by pattern
long tail query patterns from Concentrate

This chart compares the proportion of searches that go to each travel site for the top 25 patterns in the travel sector. The site getting the most traffic for each pattern is highlighted. Only searches that wound up at one of these five travel sites are considered.

The difference in search pattern profiles for these sites is striking. Tripadvisor leads the pack in the long tail, which makes sense given the huge amount of long tail user generated content on the site. TripAdvisor owns most of the pattern categories, but Yahoo Travel and Hotel-Guides take the lead in niche areas like maps and hotels. Traffic to Expedia and Travelocity is largely composed of navigational and branded queries (not shown). The only long tail patterns they have significant share for are "[x] ticket", and "cheap [x]".

The input data we used reflects referrals to these sites from a sample population of users who clicked on search engine result pages. Factors which will affect the number and type of search referrals a site received in this data include: how representative the sample is of the population of U.S. searchers as a whole, how much relevant content a site has for a given query pattern, and how well that content ranks in google and other search engines.

If a travel website repeated this study with Concentrate using current competitive data, then uploaded additional search data for their own site including other metrics beyond search frequency (see our demo using Google Analytics), the results might reveal that "things to do in [x]" queries lead to high quality visits and their site has a chance at winning more searches for that pattern. Based on this information they might decide to make a move on TripAdvisor in that content category. Mark Jackson describes some strategies to apply within the travel sector in an article at Search Engine Watch: Should Your SEO Strategy Target the Head or the Long Tail?. Using Concentrate, a travel website could streamline the process by downloading thousands of real queries for this pattern sent to their competitor:

Some queries in TripAdvisor pattern: "things to do in [x]"
long tail travel search pattern

Take Action: Some ideas for next steps

Target Long Tail Searches with Keyword Patterns

On Friday, we launched our new keyword tool: Concentrate. One of its key features is a scalable algorithm that automatically discovers patterns in large amounts of search data and clusters long tail queries into manageable groups. This post will explain how using Concentrate’s pattern discovery feature can simplify search data analysis and give you an edge on the competition. To explain how valuable Concentrate’s pattern discovery can be, we put together a case study of the travel sector using the Plus version of Concentrate and the type of competitive search data available from commercial providers like Hitwise or Compete. We will go into the details tomorrow, but here is a sneak peek at the results. This chart shows the share of travel searches by site in Spring 2006 and was generated using reports downloaded from Concentrate pattern discovery:

Travel Sector Searches: Comparing sites by pattern share

long tail query patterns from Concentrate

The Long Tail of Search

Search analytics starts by looking at the most frequent search queries driving traffic to your site or that of your competitors (these are often called the "head queries"). For most sites, these queries are a fraction of your total search traffic and just the tip of the iceberg in terms of insight about your audience. Queries like "cheap hotels in liverpool ny" may only occur once or twice in a given month, but when aggregated with other rare phrases can make up the bulk of your traffic.

The concept of the long tail in business intelligence has been a topic of debate over the last few years. One area where the long tail is alive and well is in search. The landscape of user search queries is dominated by the long tail, and most studies indicate that referrals from these long tail phrases are more likely to lead to purchases on your site. Natural search isn’t the only area where the long tail turns out to be critical. Paid search efforts which ignore the long tail are potentially missing out on a large chunk of revenue. The challenge of the long tail is that dealing with massive amounts of query data quickly becomes unmanageable.

Traditional Search Reports: head queries for some top travel sites
traditional search keyword reports

If you have hundreds of pages of unique queries to sort through manually, forming a actionable view of that data is a painful process. This is why most people only look at the first few pages of queries.

Categorizing Queries using Patterns

Finding frequent search patterns is the key to making search data understandable. Patterns let you to treat groups of long tail searches like popular individual queries.

Our concept of patterns is similar to an example described by Brian Brown in a recent SEOMoz post. Patterns are templates for searches that have a similar structure. For instance, the pattern “jobs in [x]" represents searches for jobs in some location. The “[x]" is a wildcard that can stand for one or more words. These “masked terms" are often variants of a similar concepts, like locations or celebrity names. Depending on the nature of your site, up to 80% of your long tail search traffic could be summarized using just the top 20 query patterns.

Concentrate Pattern Summary View for TripAdvisor.com
Example of Concentrate search pattern view

The next iteration of Concentrate’s learning algorithms will replace many of these wildcards with named entity labels. For example: “hotels in [x]" will become “hotels in [City]". See our FAQ for more details on special pattern categories like navigational queries. Tomorrow, we’ll cover the travel case study in detail.

Introducing Concentrate for Long Tail Search Analytics

We are pleased thrilled to introduce Concentrate™, an innovative long-tail keyword tool. Concentrate is for SEO and paid search professionals who want to make sense of search keyword data and make the most of search investments.

Check out the demo here. Or try out the free version here (you’ll need admin access to a Google Analytics account).

We built Concentrate because we saw a fundamental conflict in the world of search analysis: On the one hand, search keyword data is terrifically interesting and valuable. It can tell you what your visitors and customers want and how they think about you and your products.

Juice Analytics keywords

Unfortunately, search query data is also big, messy, and hard to get your hands around. In a typical month, the Juice site gets over 10,000 visits from over 7,000 unique keywords.

Even if I could somehow wrap my head around our top 100 keywords, I’d only understand 25% of the visits. For people spending money on search engine optimization or paid search campaigns, that’s a big blind-spot to accept.

We want you to understand and act on all your search data. Concentrate ingests data from sources that most sites already have available (e.g Google Analytics, Omniture, Coremetrics, Hitwise, Compete, etc.), enhances this data by finding common patterns and query types, and visualizes search phrases for exploration and analysis.

Over the next couple of weeks, we will share examples of some of the interesting things you can do with Concentrate, including:

Pattern identification to condense the long tail into keyword phrases with similar structures. For example, here are some common search patterns from a cooking web site (the “[x]” represents a wildcard).

Patterns

Keyword visualization to show the connections between keywords and the relative performance of phrases. This wordtree shows the frequency of words within phrases (size) and average time spent on site (color).

Wordtree

Congratulations to Chris, Pete, and Sal for all their hard work, diligence, and creative problem solving to launch this solution.