
How to Create a Successful Real-time Dashboard

https://parall.ax/blog/view/3045/tutorial-realtime-tv-monitoring-with-raspberry-pi
Real-time dashboards provide a single view to the most important performance metrics for an organization. Data exploration takes a back-seat to a focus on monitoring trends and progress to goals. Real-time dashboards show up on big screens in call centers, monitors in marketing departments, or the desk of a fictitious Private Equity titan on the TV show ‘Billions’.

CREDIT: JEFF NEUMANN/SHOWTIME
The job-to-be-done for real-time dashboards is to monitor status and support immediate decision-making.
The information must be easy to interpret, alert users to problems, and make the next action obvious. In addition to key success metrics, real-time dashboards may show detailed data about the action “on the ground.” Here are eight characteristics that make a real-time dashboard effective:
1. Summary status
The summary status that indicates how things stand overall. Users need to be able to tell at a glance whether they should worry or not. Some dashboards can summarize in a single measure, for example, a “threat level”, that lets everyone know at a glance whether further attention is required.
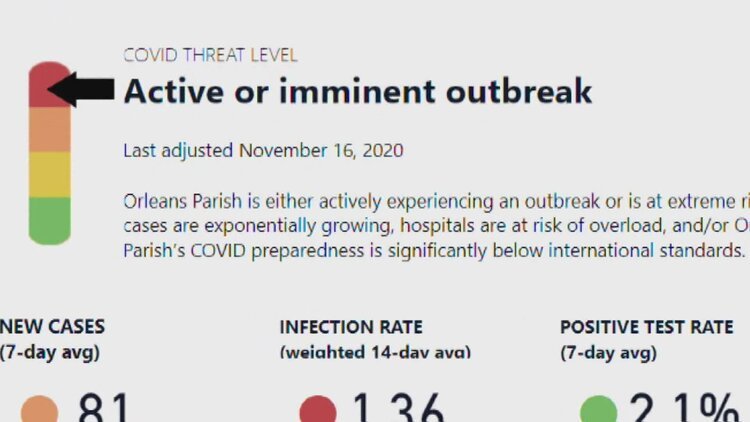
New Orleans under 'Code Red' level
2. Business drivers
Your dashboard should express a well-understood structure of the business. By the time you design a real-time dashboard, you should have an understanding for how the pieces of the business fit together (i.e. the relationships between key measures, drivers, and available actions). For example, in the call center business, there are clearly defined success measures (e.g. wait time), a mathematical relationship between these measures and their underlying drivers (e.g. call volume), and known levers to address problems (e.g. staffing levels). Your real-time dashboard isn’t for exploratory analysis to find what matters; it is for presenting and emphasizing what matters.
3. Rapid diagnosis of problems
The data presentation should point directly to the likely source of the problem. Real-time dashboards aren’t the place for deep analysis or introspection into the drivers of the business. Here’s a great example of a server management dashboard that makes it immediately obvious where things are going well or poorly.

Dashboard from Motadata
4. Simple data presentation.
Real-time dashboard’s aren’t the place for complex or advanced data visualizations. Imagine you were Napoleon and you had to use a half-completed version of this chart to make a battlefield decision in the next 5 minutes.

Charles Joseph Minard’s famous infographic is better as a retrospective than a real-time dashboard
5. Granular view of the “unit of action.”
Real-time dashboards are about tracking current activity. It may be useful to show the raw data around these events in the form of a ticker, scroll or detailed table. Google Analytics offers a real-time view that lets you view the activity of an individual, random visitor.

Google Analytics
6. Appropriate time window
Getting time right on a real-time operational dashboard is critical. If the measures and trends represent too long a time period, users may not react to changes quickly enough. On the other hand, very small time windows encourage frantic reactions to changes that may not represent real trends. Ideally, the dashboard should offer the ability to configure this time range and “freeze” a moment in time.
7. Prominent but balanced alerts
Naturally, alerting users to problems is a central mission for real-time dashboards. The challenge (as always with alerts) is to balance between “the sky is falling” hysteria and “don’t worry, be happy” apathy. I’ve written before about alerts, but one item to emphasize is the need to show a sense of relative importance. Not all problems have the same impact on the business, and finding a way to communicate this relative importance is valuable.
8. Point to specific action
If real-time dashboards are about identifying and responding to issues, the tool should point users to what they can do about a problem. This can be as simple as displaying the phone number of the right person to call.
If done poorly, your real-time dashboards can create mayhem, but a well-designed dashboard will bring an organization together to focus on the right metrics and ensure rapid reactions to changes.