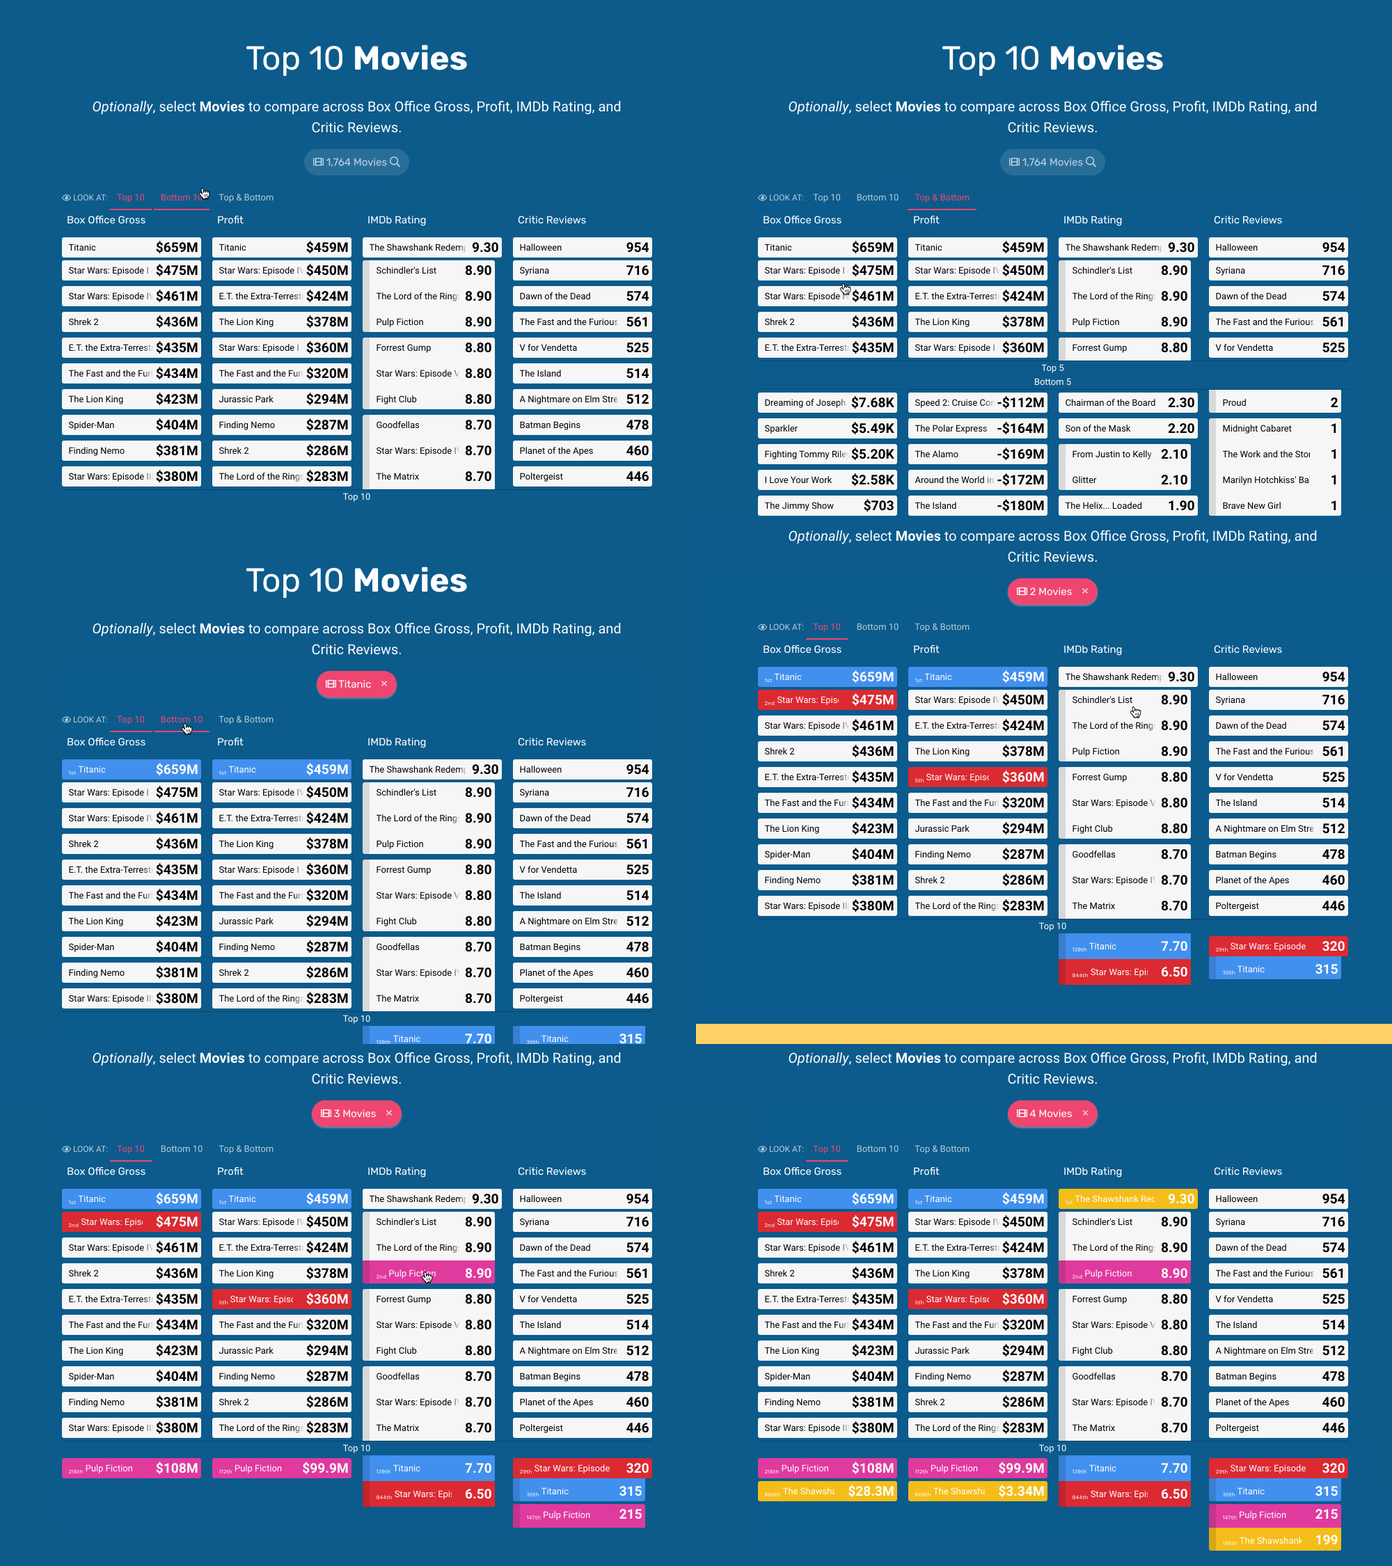
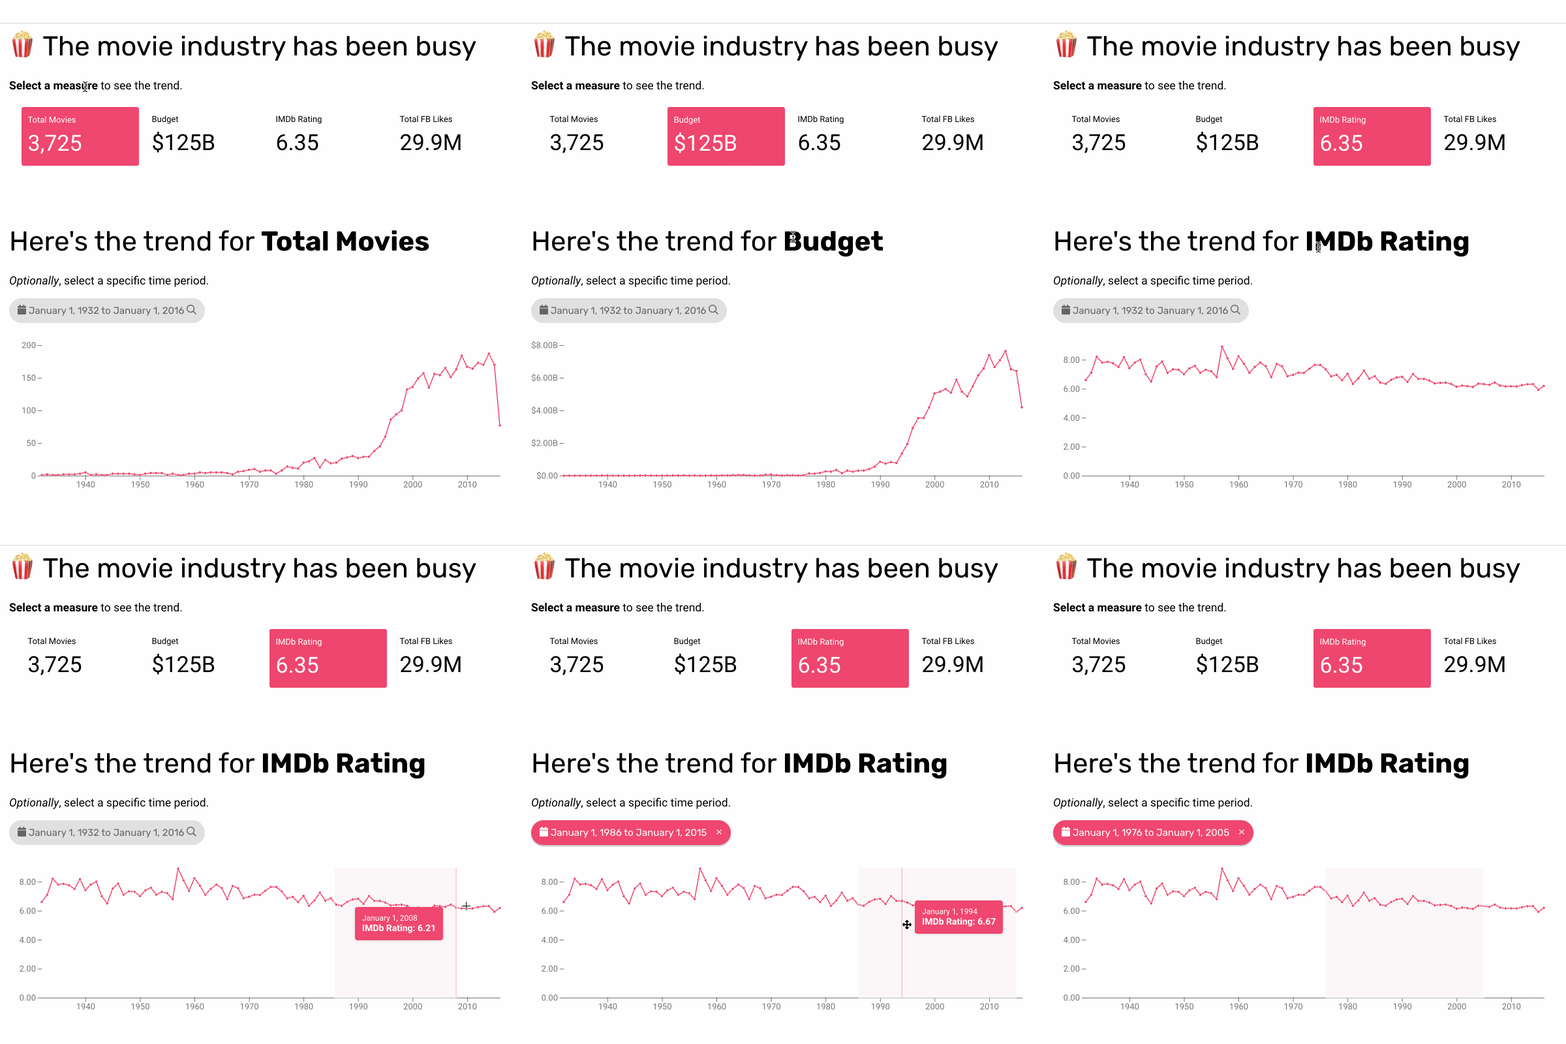
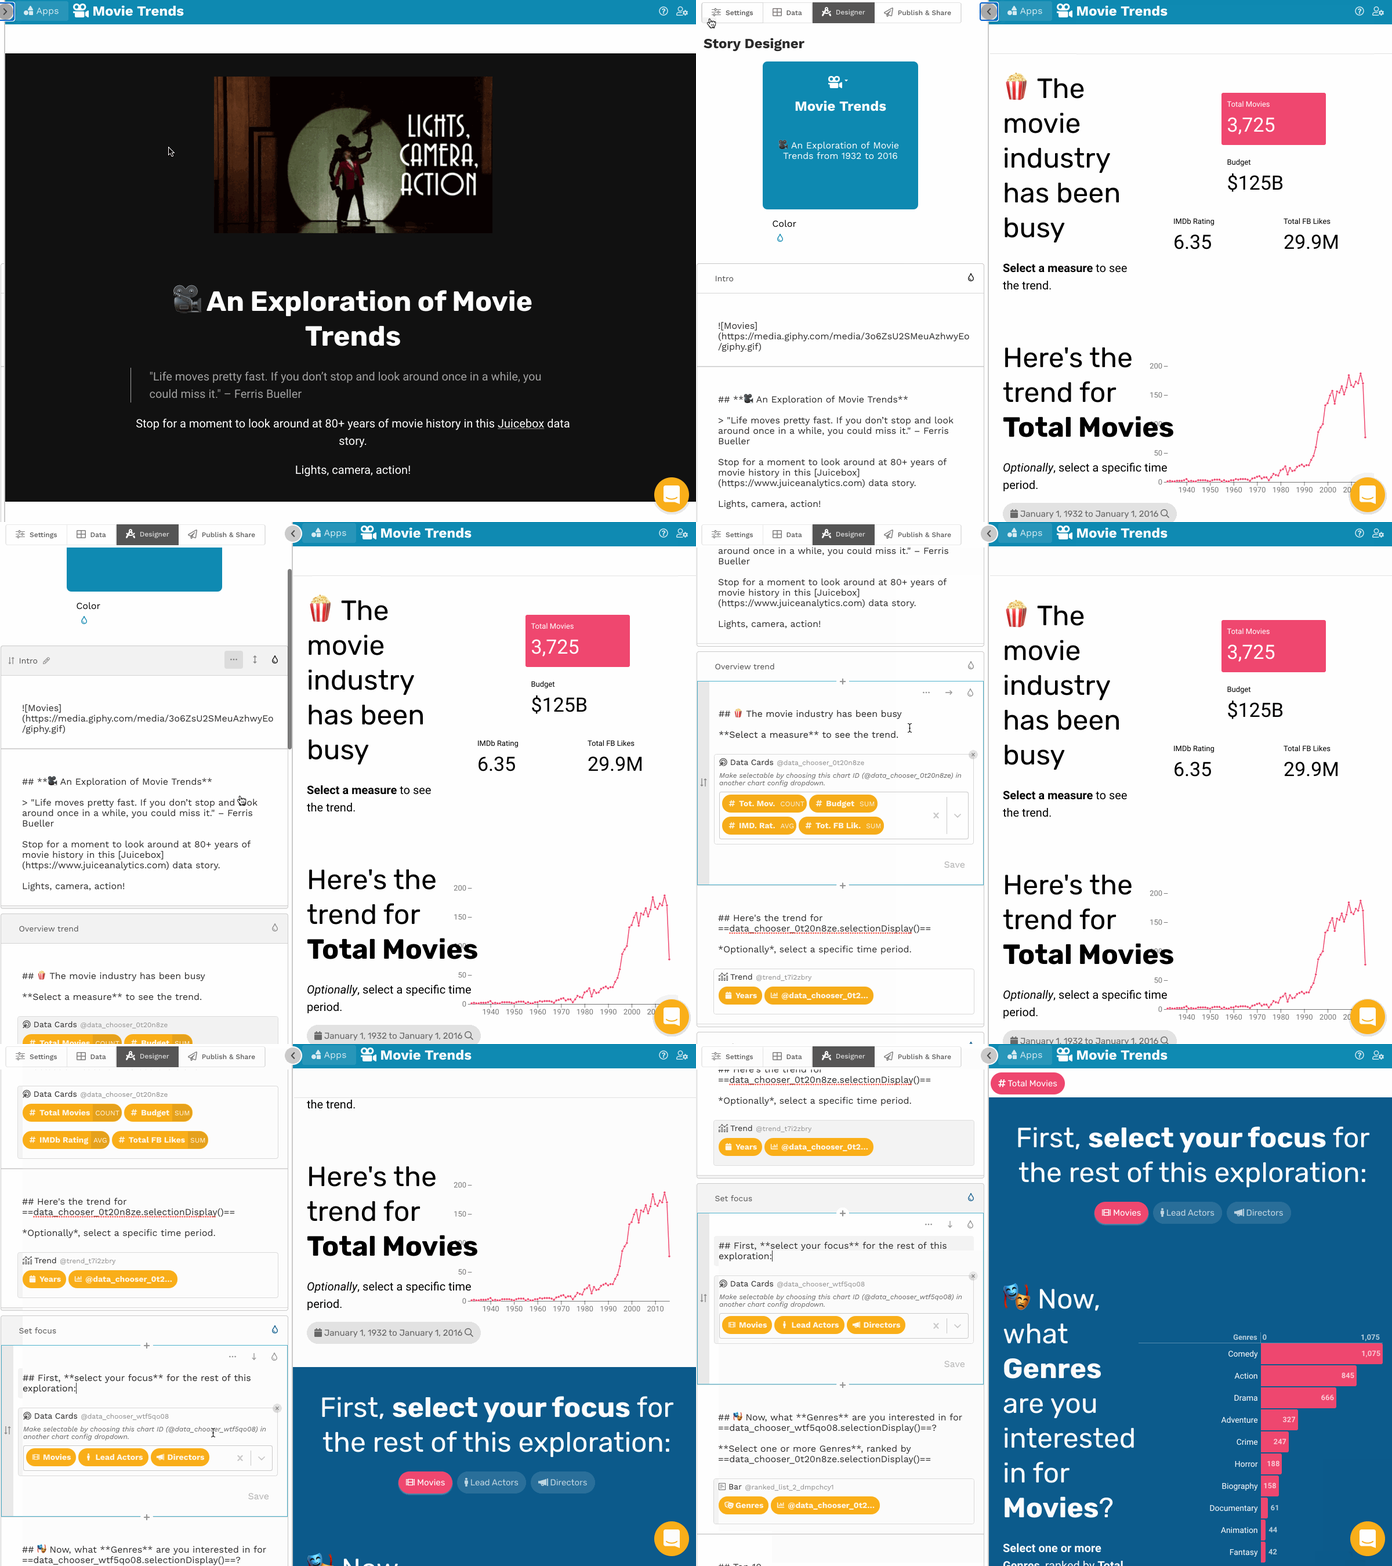
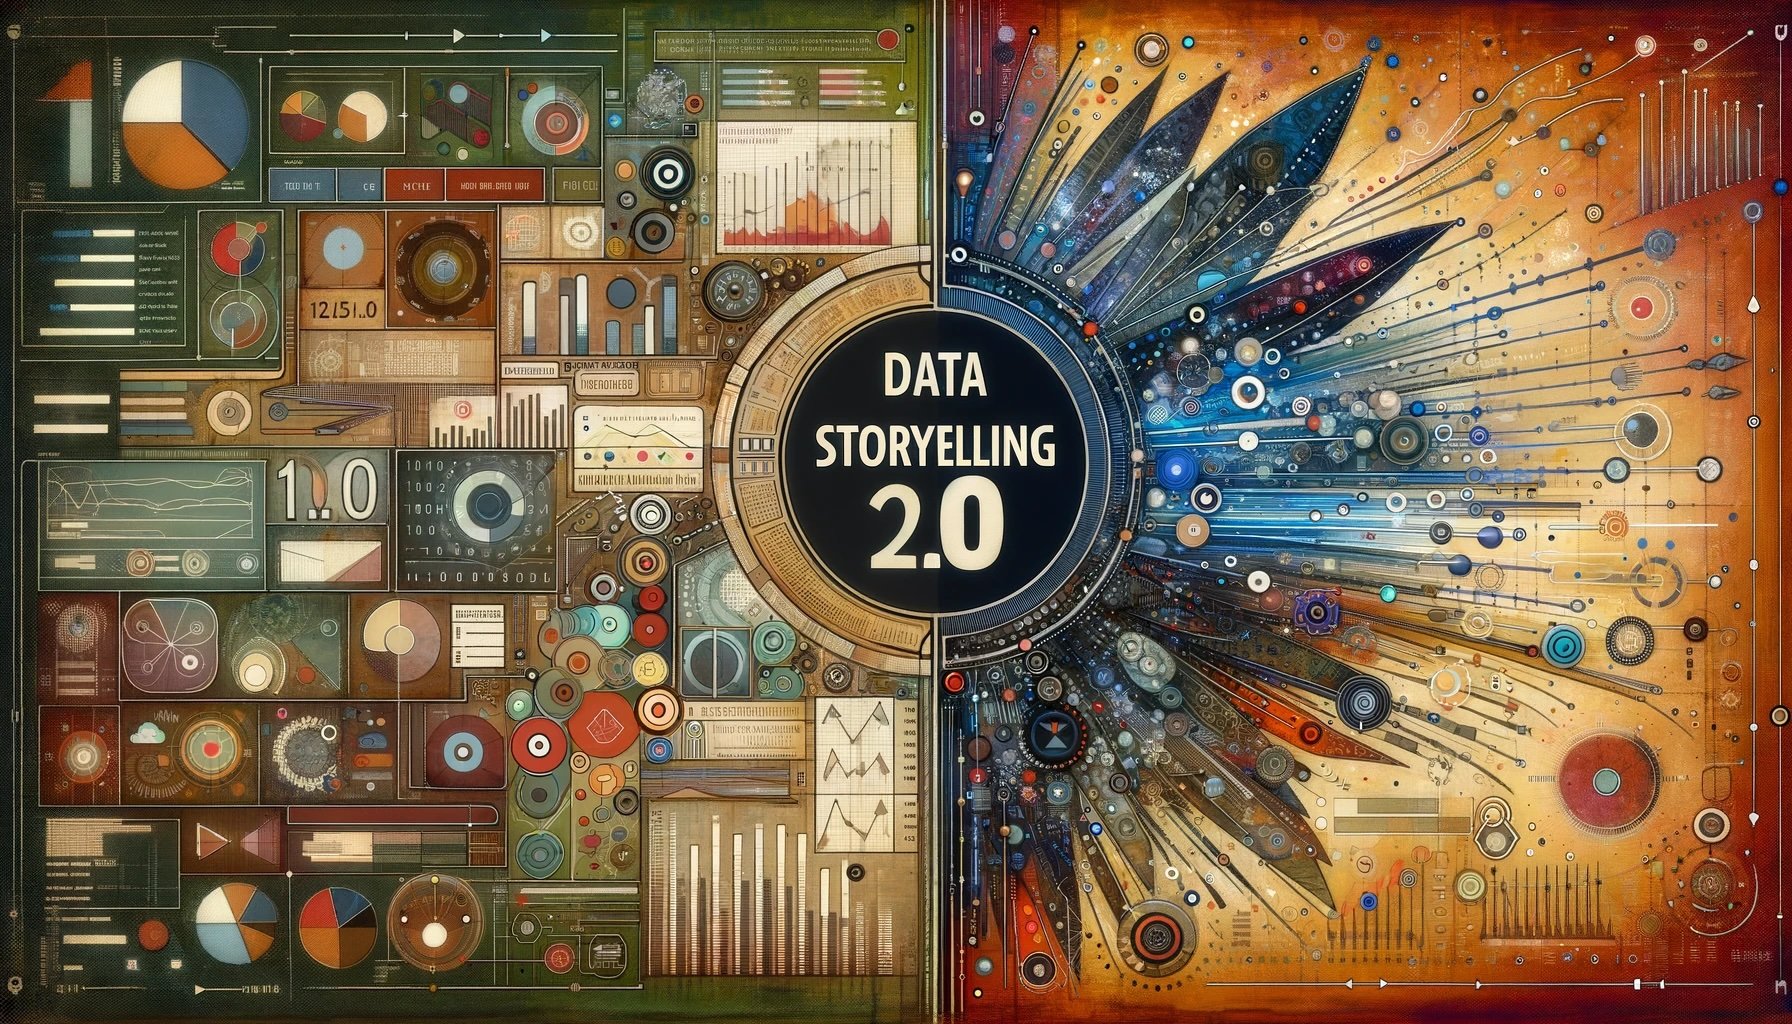
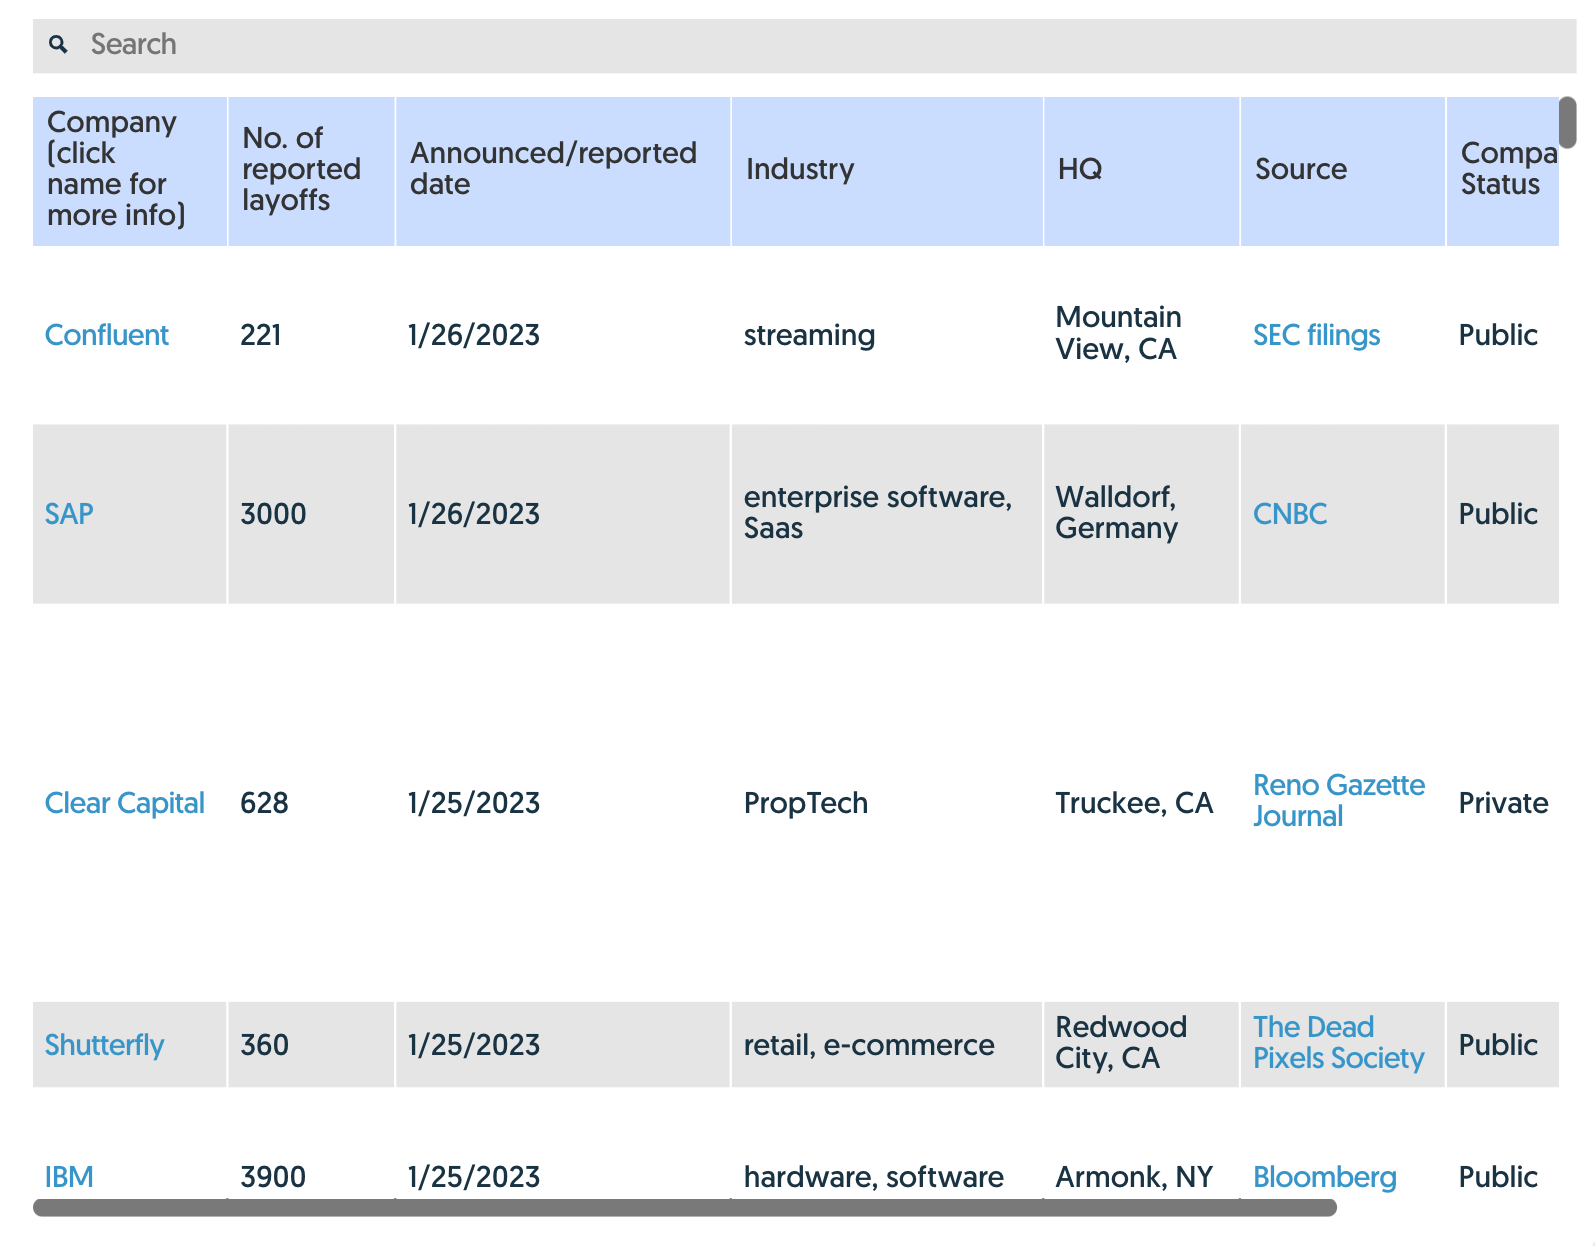
Traditional dashboards are good at showing a full-status picture all at once. Visual analytics tools are great for flexible exploration. But neither of those solutions were designed to tell stories with data. Data storytelling is a new model for communicating information to an audience using narrative flow, text, and visuals to engage, educate, and move people to action.
In this new era where the audience needs to come first, the priorities are different. Here are seven essential features necessary to deliver compelling data story applications.
1. Human-friendly visualizations
Your audience should be able to easily understand your data presentation the first time they see it. Using common language and clear images is key to achieving this effect.
2. Integration of text and visuals
There are lots of tools for creating graphs and charts, but data stories are a combination of data visuals flowing together with thoughtful prose and carefully-constructed explanations. It's important to first set the stage for what you're presenting, then give context and add detail to your data story.
3. Narrative flow
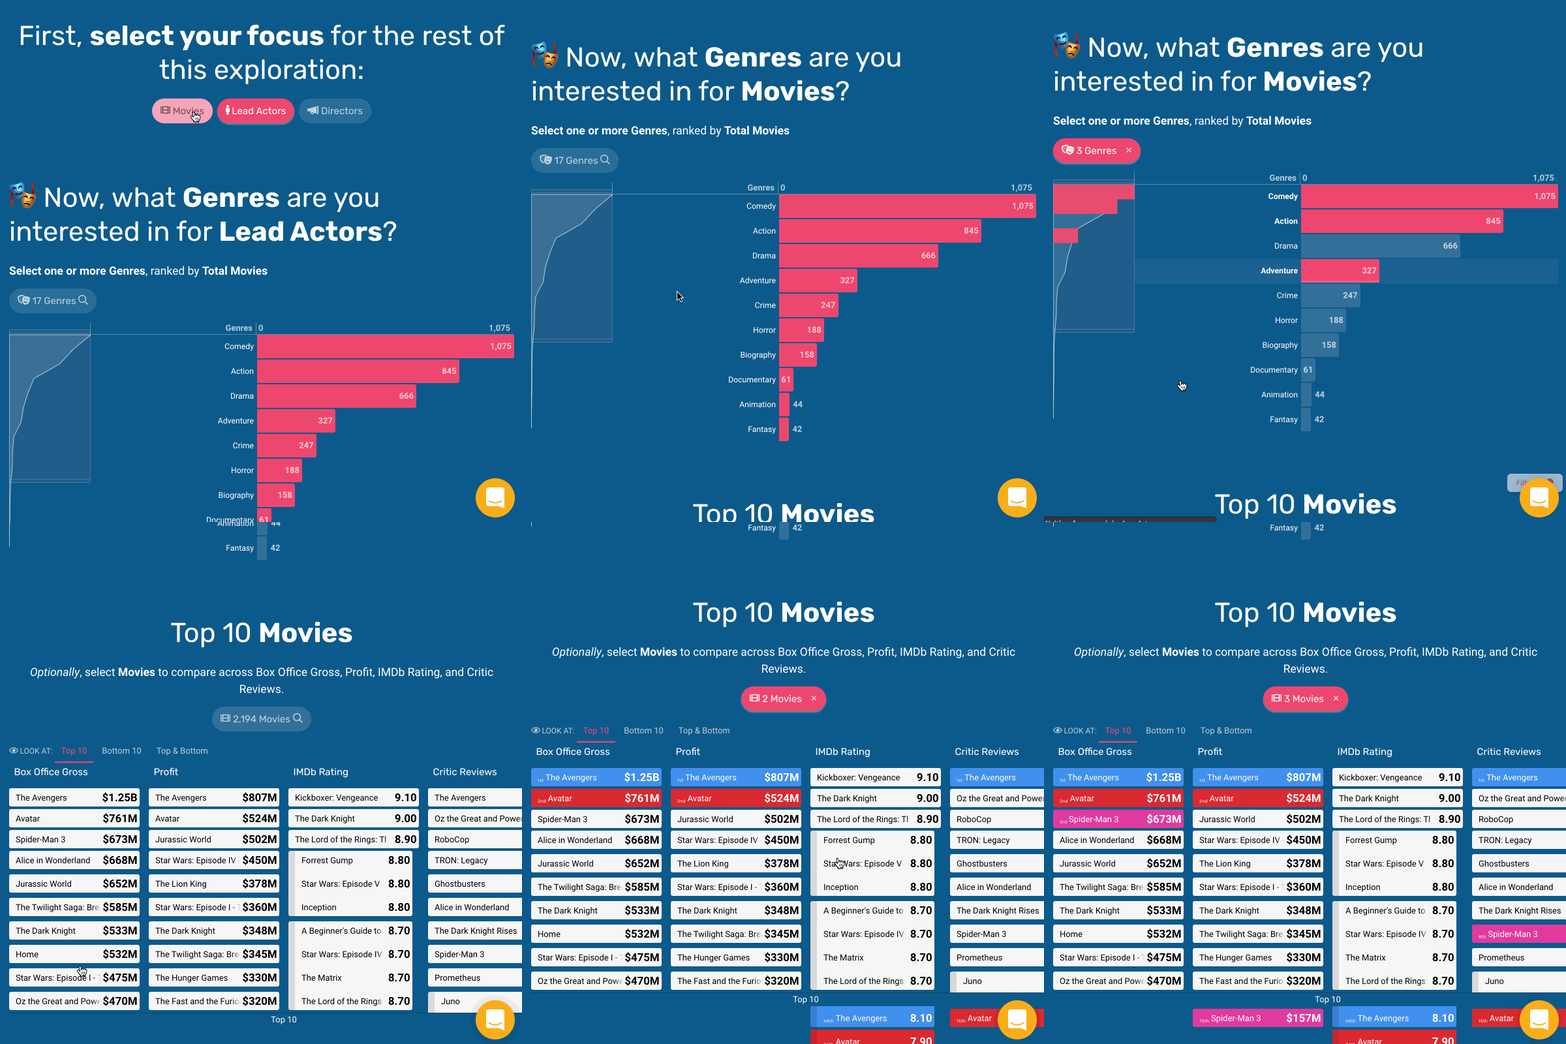
The text and visuals should carry your audience from a starting point (often the big picture of a situation) to the insights or outcomes that will influence decisions. Every user selection helps craft a relevant story.
4. Connected stories
In many cases, it takes more than one data story to tell the whole story. Think of exploring your data as a 'Choose Your Own Adventure' book, in which the audience can pick a path at the end of each section to follow their interests.
5. Saving your place
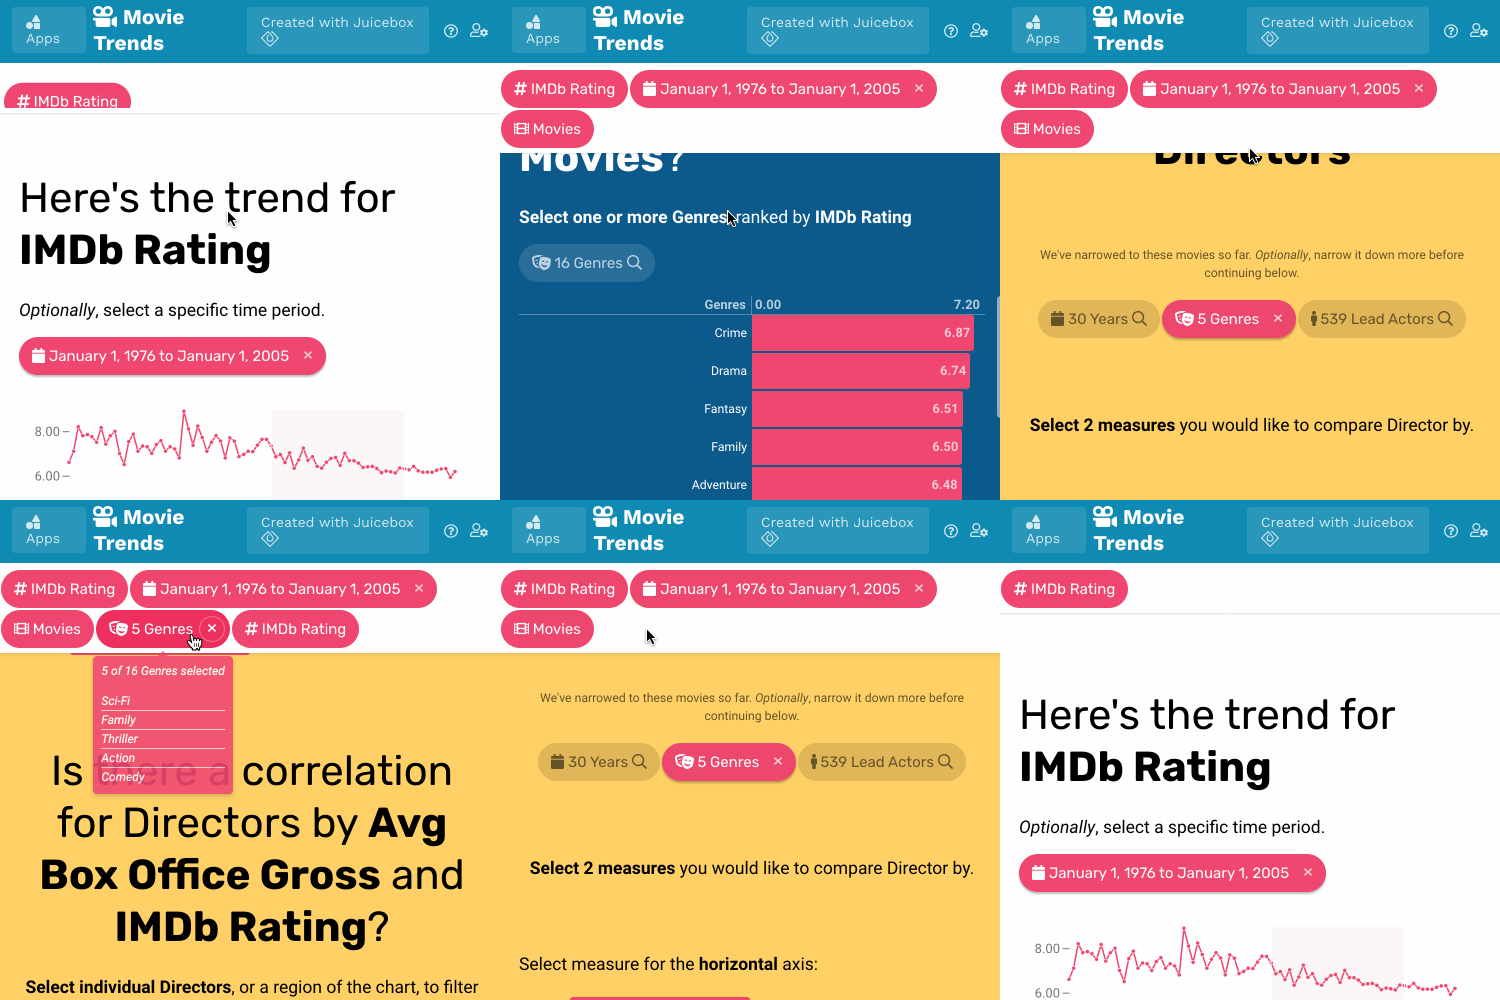
The bigger and more flexible a data story becomes, the more important it is to let the audience save the point they’ve arrived at in their exploration journey. In this way, they can come back to the analysis over time and share it with colleagues.
6. Sharing and collaboration
Data stories are often a social exercise with many people in an organization trying to find the source of a problem and what they should do about it. Therefore it is critical to give users an easy way to share their insights, discuss what they’ve found, and decide on actions together.
7. Easy authoring
Last, and possibly most important, everyday citizen analysts need to be able to create their own data stories. A data storytelling platform can’t be constrained by the typical back-and-forth between technical and non-technical people that is common with many analytics tools. It needs to be as easy as creating a presentation.
Juice has built the world’s most complete solution for creating interactive data stories. Interested in learning more? Give it a try.

