A data fluent organization should have a massive appetite for data. As you build your data fluency in front-line decision-makers and create a vibrant ecosystem, the demand for data products will grow. And if there is one truism in analytics, it is:
Good analytics generates better questions.
In what form do you answer the growing array of questions and needs? What data solutions or products do your data consumers needs? There are many choices:
Dashboards
Reports
Self-service BI tools
Predictive models
One-off analyses using slides
Spreadsheet models
It is a confusing array of ways to deliver data to these data consumers.
What’s the right tool for the job?
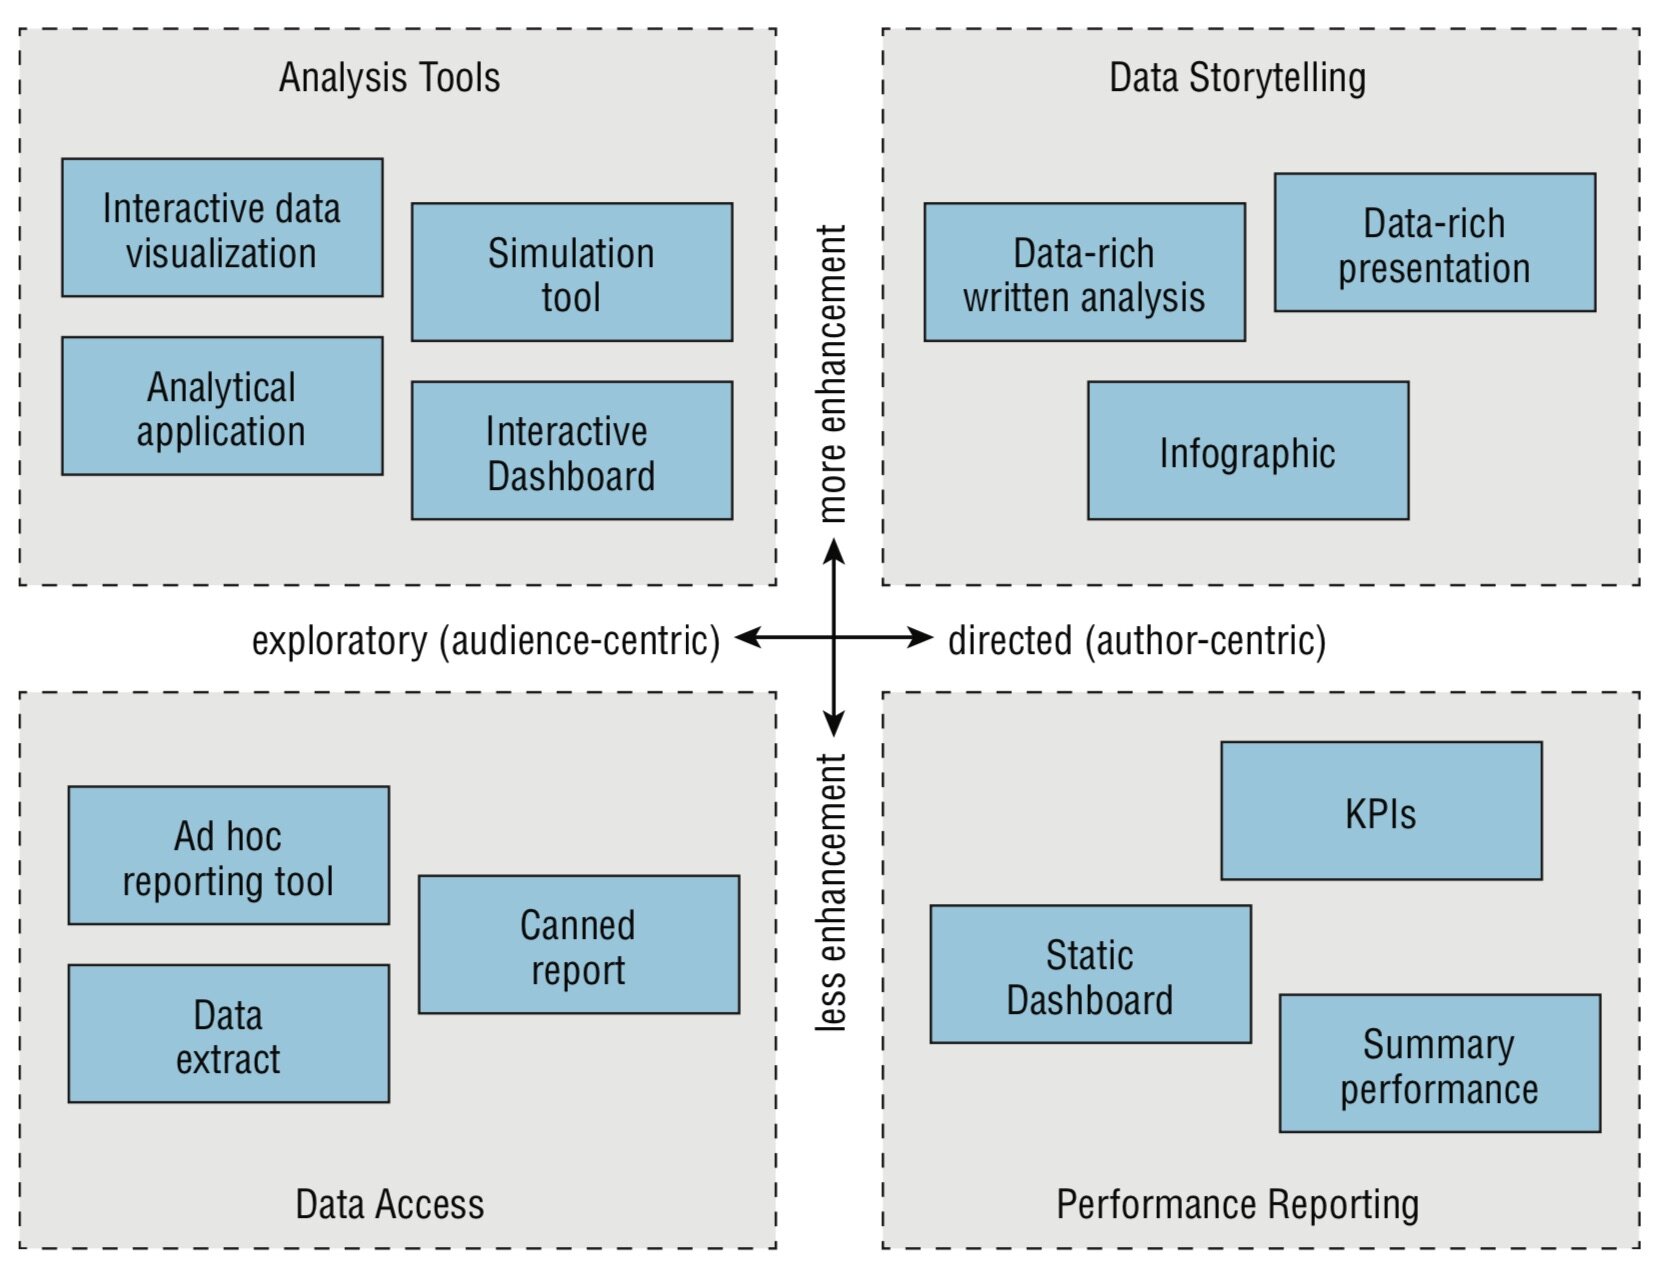
Of course, there isn’t a single answer; it depends on the specific needs. Start by considering these two dimensions:
How much flexibility and control does the data consumer need? Do they need to be able to dig deeply into the data, or can results be shared with a static presentation of insights?
How much will the raw data be enhanced with analysis, modeling, and pre-digested insights? For some audiences, simply knowing the trend of key metrics is sufficient.
Across these two axes, it becomes clear there are a wide variety of different forms of data products.
Take the marketing function as an example:
Analytics Tools (upper left): A Marketing Analyst wants to explore the performance of different advertising campaigns to understand what creatives are working best.
Data Storytelling (upper right): A Director of Marketing needs to present a data-driven plan for spending to convinced the executive team to allocate budget.
Data Access (lower left): A Data Analyst needs to extract data from a 3rd-party platform to explore the behaviors of new users.
Performance Reporting (lower right): The CEO wants an overview of marketing performance to share with the sales, product development, and the Board.
With so many different needs and use cases, it seems evident that there isn’t just one tool that can fill all these situations. My friend at GoodData, Roman Stanek, has been talking about ‘Data as a Service’, the transformation from traditional, tightly-coupled data platforms to a new model:
The data industry now has a unique opportunity. Cloud-based data infrastructure can allow every decision to be data-driven. And as both people and machines make decisions today, this new infrastructure needs to support automated decision-making as well. We need to break down the monolithic nature of existing BI tools, and we need to deliver Data as a Service to every device and person so that access to data becomes truly pervasive.
He recognizes the diverse needs of data consumers that we see as organizations become more mature in their data fluency. A restrictive dashboard tool isn’t the right answer for telling a data story nor does it serve the data scientist who wants to spend less time extracting data and more time exploring the data.
If you’ve made the commitment to becoming a data fluency organization, you’re already thinking about how to better serve all the people who might be working with that data. Mapping the right tool to each specific job-to-be-done is an essential step.