
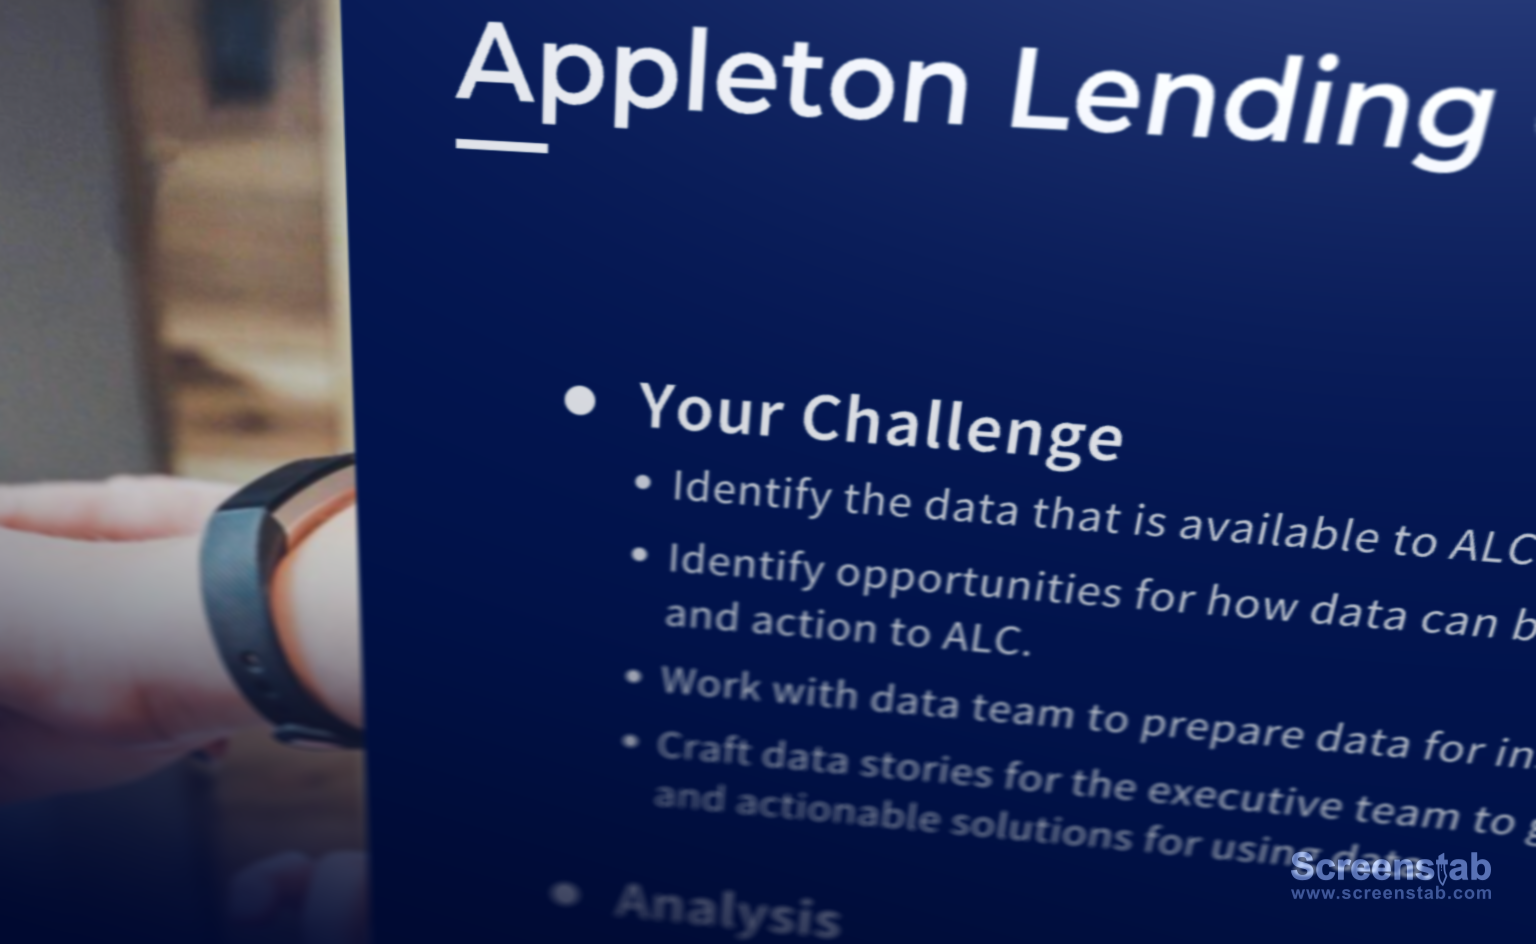
What do you get when you put a Data Scientist and a Data Storyteller in a room full of executives for two days?
Sorry, no punchline…this is serious. The answer is The Data Story Creative Process (DSCP) workshop — a hands-on, case study-based learning event that teaches a framework for using data to drive informed action.
We played with data, explored insights, structured stories, and discussed the barriers to reaching our audience. Here is a tasting menu of the lessons we shared:
A repeatable process
Every data project is unique. Yet our methodology applies common steps and best practices to bring discipline and focus. The DSCP is a more thoughtful approach to solving tough problems with data.

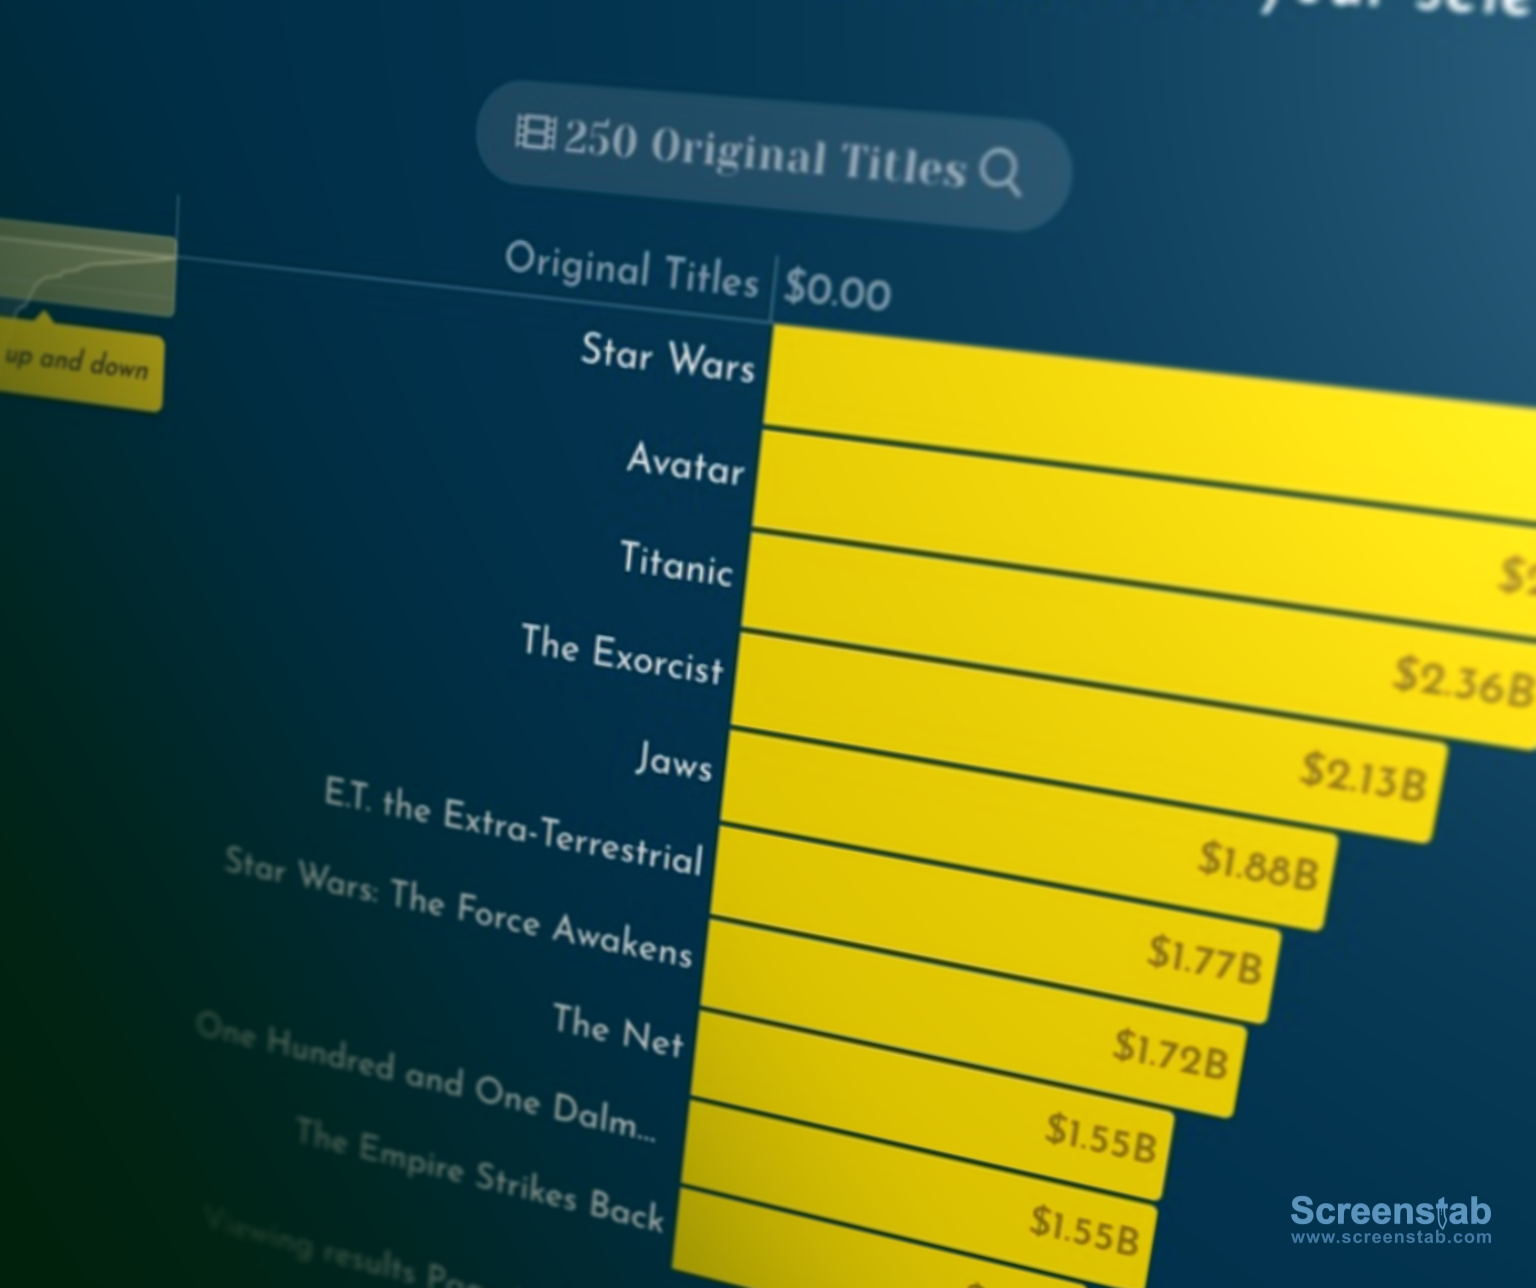
Hands-on learning with real data.
We learned a lot from our workshop. Lesson 1A: People like to get their hands into data in a realistic scenario to apply the concepts and skills we are teaching.
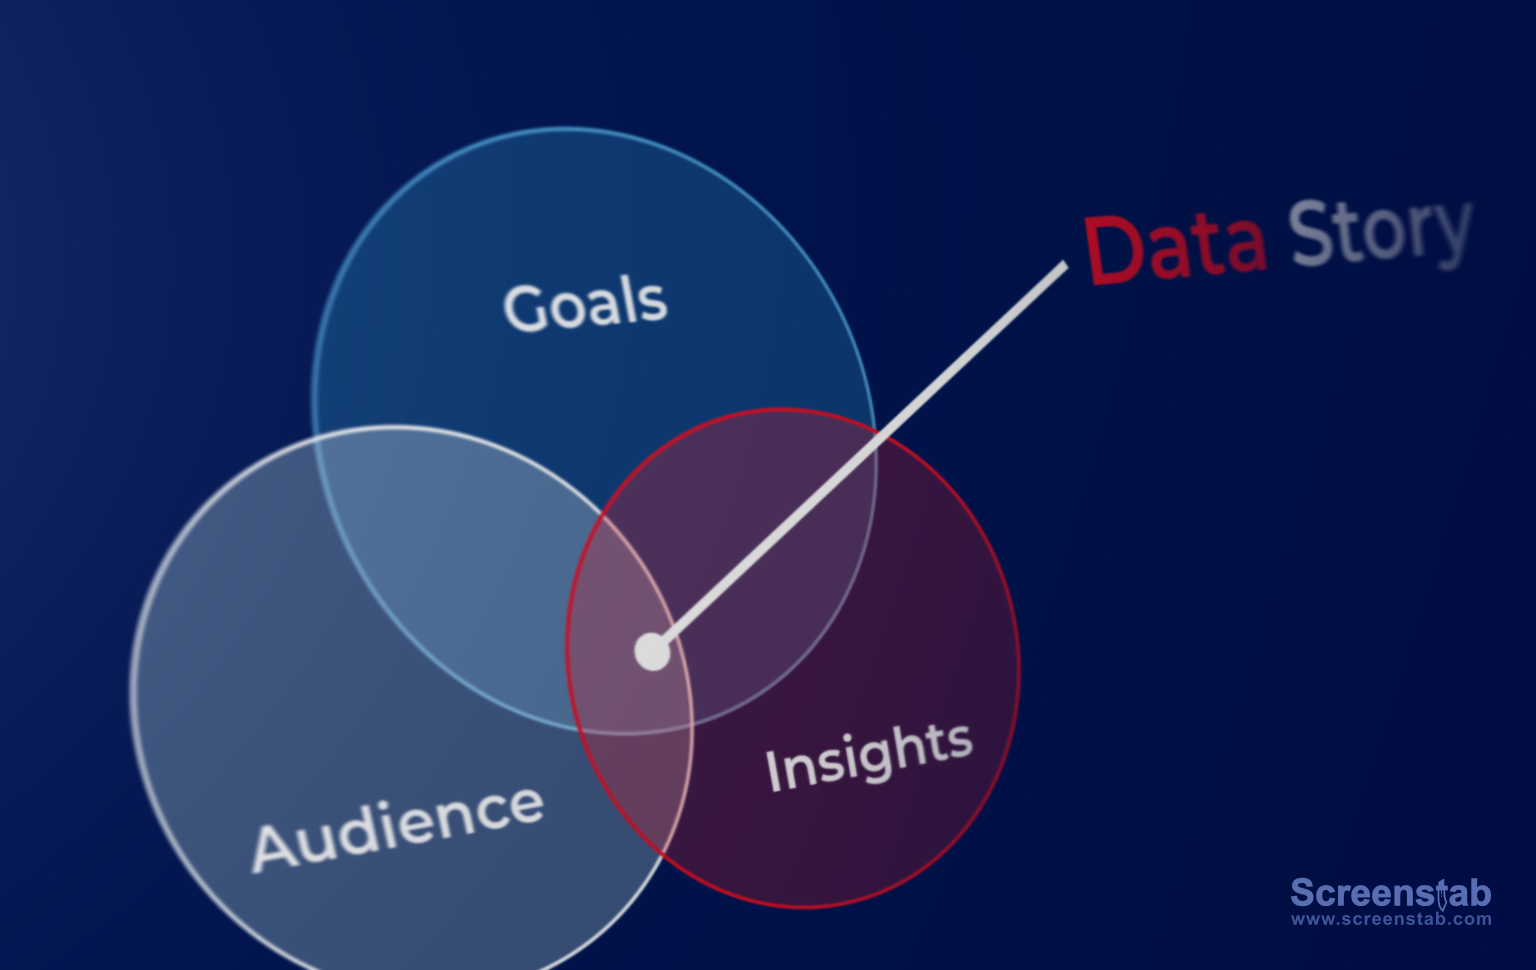
Find your data story
Your data story exists at the intersection of your goals, your audience’s priorities and levers, and the impactful data insights you are able to find.
This is one of many places where we emphasize the need for focus.
Visualize for readability and shared meaning
When it comes to visualizing your data, you have two primary objectives:
Readability: How do you minimize your audience's effort to understand the visualization?
Shared Meaning: Does the visualization support and emphasize your insight?
Guide your audience to actions
Actionable insights should be the goal of your story, even if that action is a need to gather more data. We discussed the characteristics of a data-driven action and the frustrations of presenting insights that can’t be acted upon.

The goals is to change the mind of your audience
Working with data is a matter of mindset as much as skillset. Most importantly, you want to understand the needs of your audience so you can tell a story that changes their perspective.

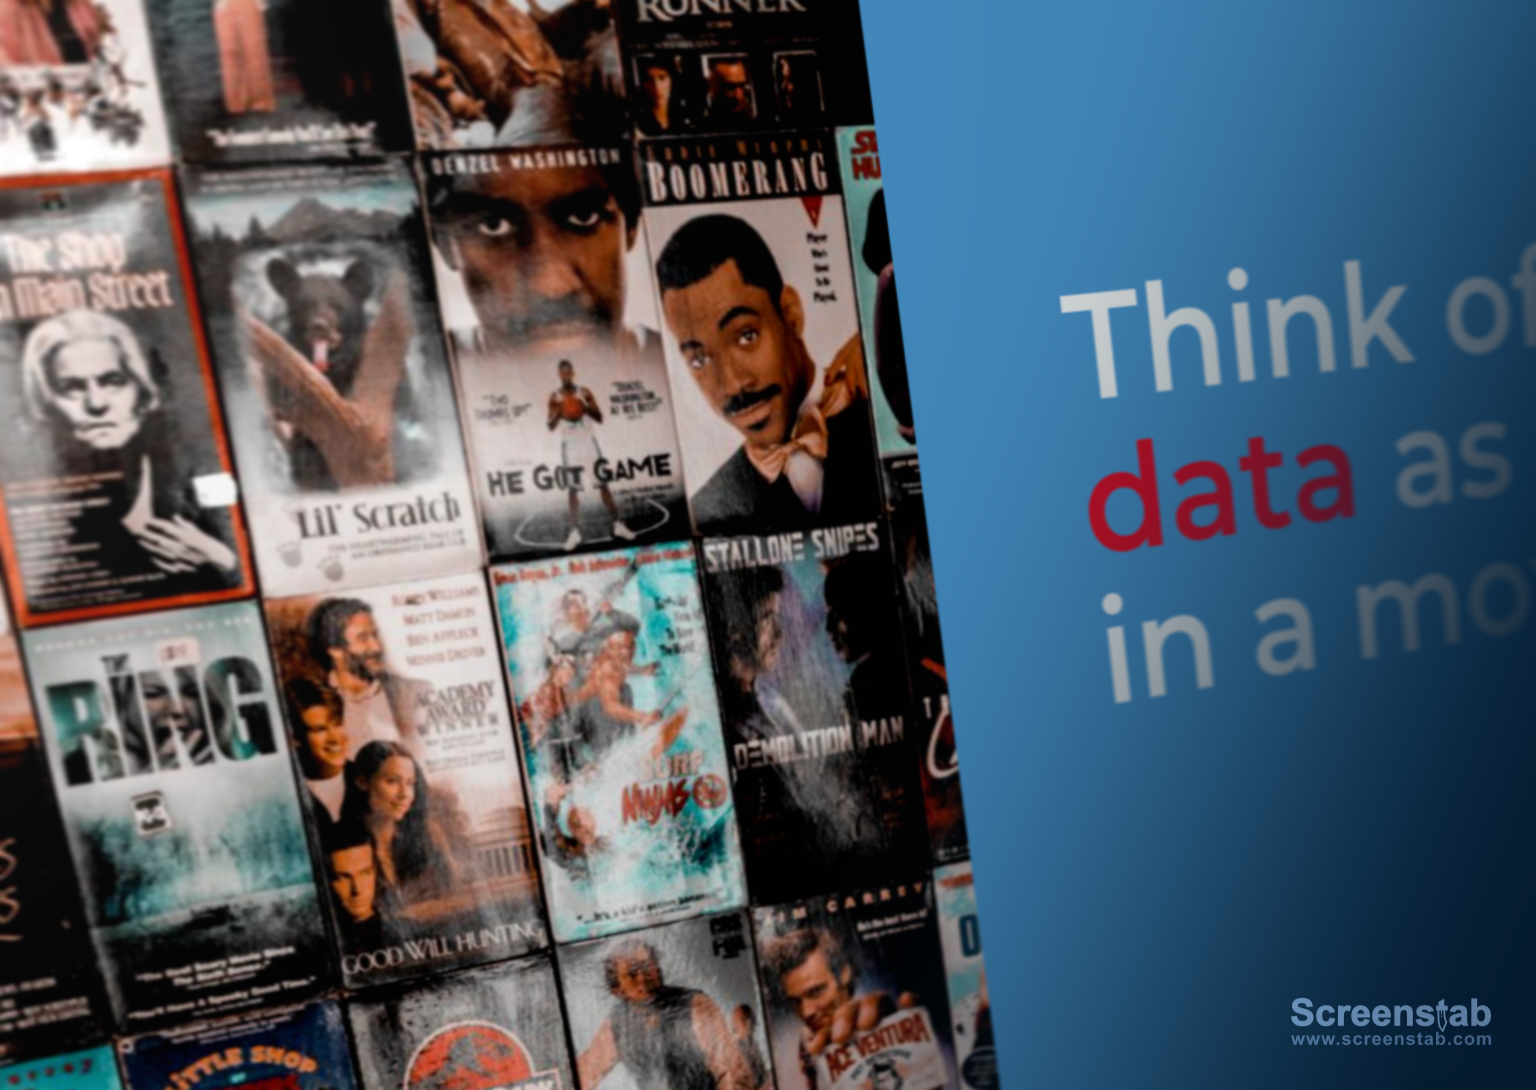
Where are you in the movie?
Charlie shared a fantastic analogy for considering how to analyze data. You want to think of the data as if you are at a particular scene in a movie. You can look back to understand what got you to that particular point. Then you can use models to predict where the story is going to end up.
Data is a team sport
Our workshop discussion underscored our belief that data is a team sport. You need different players — the analyst, the subject matter expert, the decision-maker — to work together from the beginning to chart out a successful path.

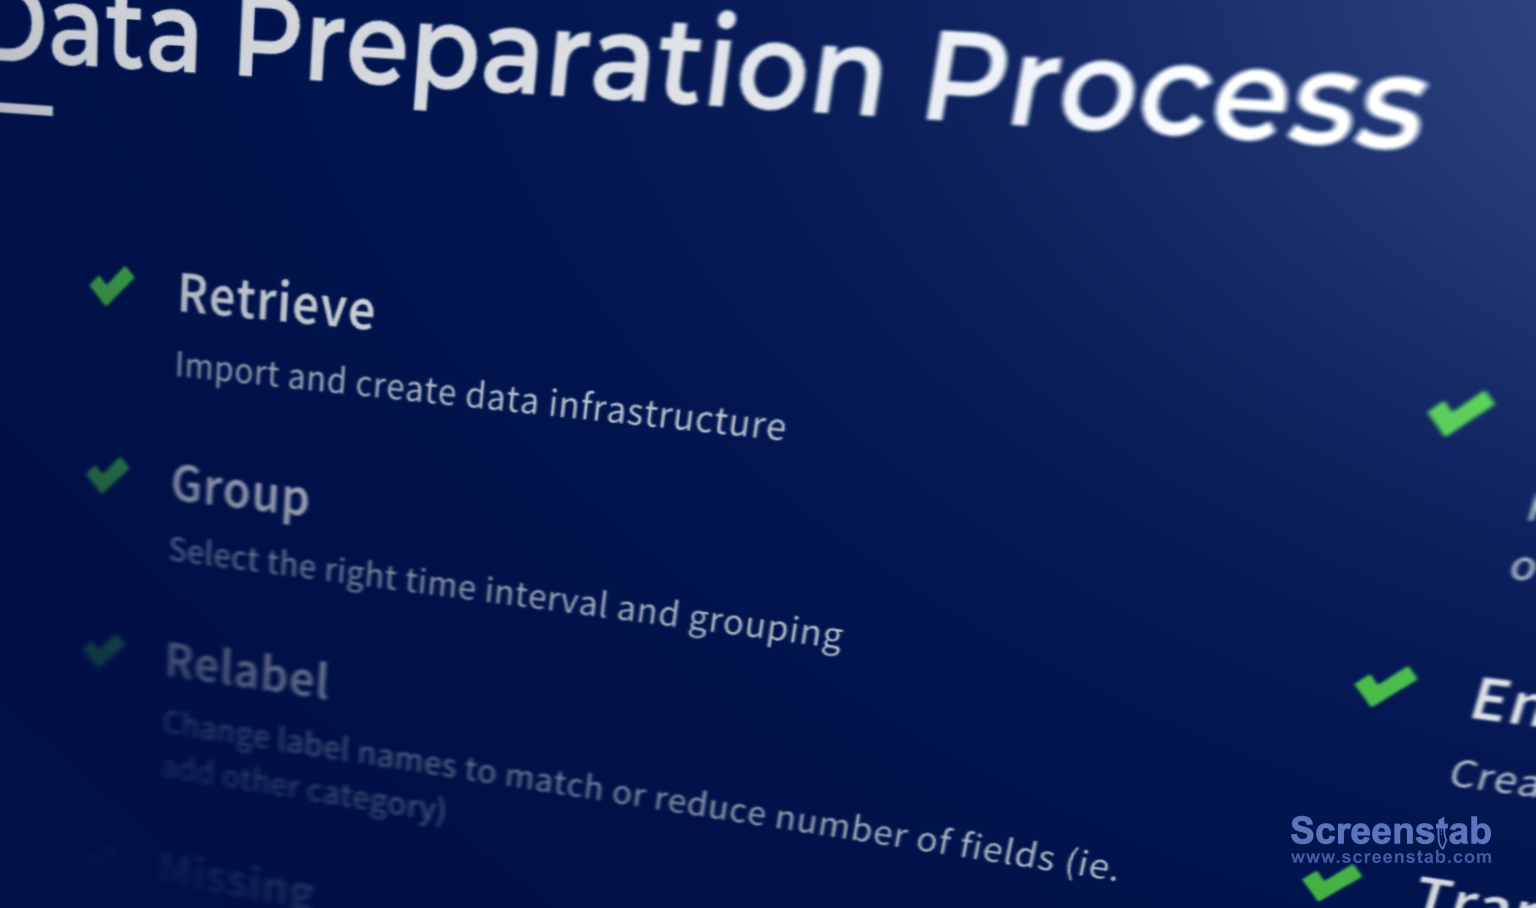
Preparing your data
Preparing your data is the hard work that needs to be done before the fun begins.
For our executive audience, we wanted them to appreciate the potential complexity and effort that data preparation can require.
Demystified data terminology
There are a lot of data buzzwords and abbreviations flying around: AI, ML, lakehouse, data engineering, storytelling. We took some hot-air out of these terms and discussed what they really mean.
Different sources of insights
Finding data insights is part of the “Play” stage in our process. And there are many tools and techniques to reveal those insight. We want to combine both data-led insights (e.g. modeling) with exploration that is guided by human understanding of the problem.

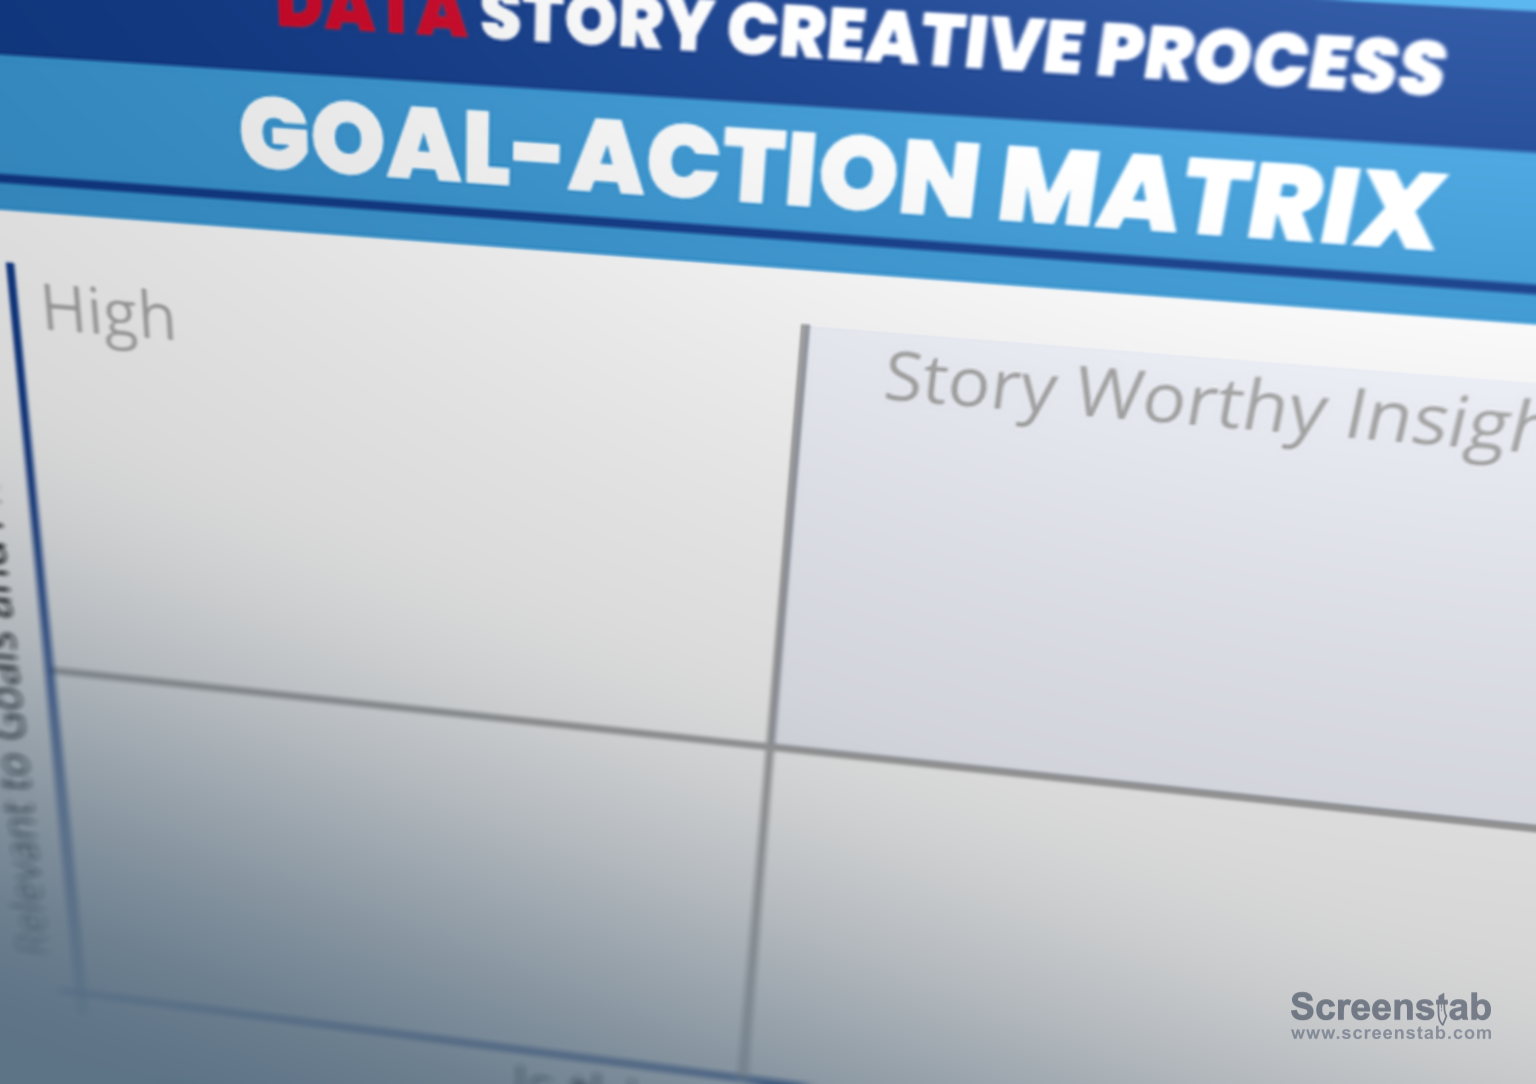
Kill your darling data insights
Analytical play-time is great, but at some point you need to evaluate and extract the most valuable and actionable nuggets. We provided an approach for sifting through insights to find those that are “story-worthy.”
Structure a data story
Data storytelling uses the patterns and expectations of traditional narratives to grab and keep the attention of your audience. We can use the classic three-act play structure to set-up and deliver on inherent story expectations.

The (Short) Attention Economy
With our full inbox and onslaught of text messages, it is hard to grab and keep the attention of your audience. We shared techniques that can help your data story stick: be unexpected, connect to emotions, be specific, and be relatable.

Advocate for your data products
Our workshop was about defining a problem to be solved with data and creating the data story that will lead to action. We closed with a final message: you need to step up to advocate for your results. Think of your dashboard, report, or analysis as a product, one that needs to be marketed and sold for people to get the value.

