


66,038,000 years ago, a massive asteroid smashed into the earth in what is now Mexico's Yucatan Peninsula. After this massive collision, it took only 33,000 years before the dinosaurs were entirely extinct — a blink of an eye in terms of the history of the earth.
This asteroid is considered to be the "final blow" after a series of ecosystem changes (other asteroids, volcanos, etc.) created a fragile environment for the poor dinosaurs. The climate changed, the dinosaurs died out, and the mammals took over.
Incumbent solutions for delivering data —dashboard and reporting tools— are facing their own "fragile environment." The big asteroid may not have hit yet, but it is only a matter of time. Here's why.
Exhibit A:
A thoughtful answer from an experienced Tableau user to the question “Why do people still use Tableau?”
We need to consider why (and when) people might stop using Tableau. My opinion is that Tableau has failed to realise two important things about their software and that if another company can solve this problem then Tableau could really lose out:
1. Companies need to create applications, not just reports
Yes, Tableau is interactive but you cannot use Tableau to make applications that write back to a database. It has maps, yes.. But you cannot use Tableau as the basis for an app like you might with MapBox (which has multiple SDKs for different platforms) or Leaflet.js for instance. Tableau is not designed for this, so if you need apps and not reports then it is not for you. You need a developer (or dev team) instead. This is a big gap in the product that other companies are also failing to see.
2. Tableau’s software does not directly generate revenue for (the majority) of their users
For a company to run several copies of Tableau desktop costs several thousand pounds. This is without the additional costs of Tableau Server or end-user licenses that you will need if you want your customers to use your hosted visualisations and dashboards. Any business that chooses to use Tableau to deliver interactive reports to its customers would need to consider passing some of that cost (or all of it) onto its end users. But when we’re talking about interactive reports, not applications, it is hard to justify data reporting as a stand-alone or additional cost.
That’s a real user wondering whether the paradigm of visual analytics tools for analysts, dashboards for executives, and reports delivered to customers and stakeholders is going to hold up for much longer.
Exhibit B:
Analytics vendors and market analysts are using language that leans more toward delivering "apps."

Alteryx
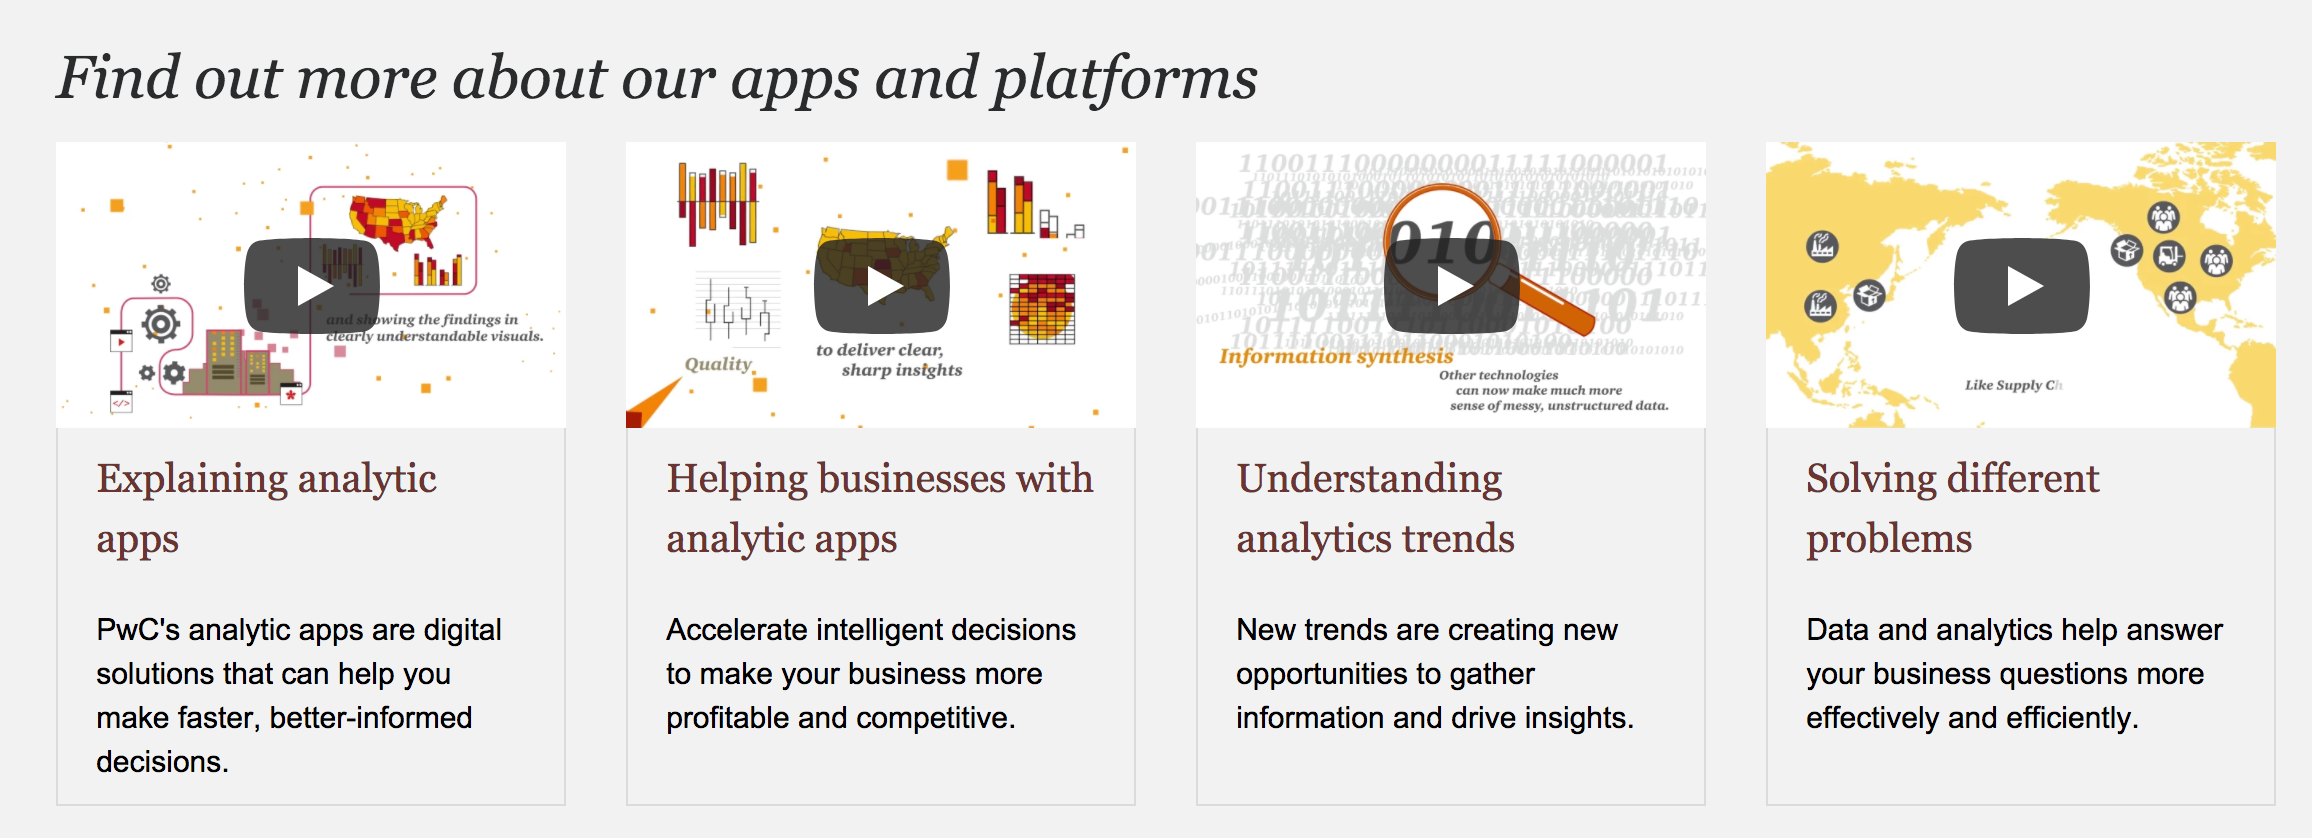
PwC analytical app marketplace

Infor

Gartner's IT Glossary

IBM Cognos
Is “app” more than a rebranding of a decade of data visualization tools? We think so. Here’s why we see analytical apps are on the way to taking over the BI world:
1. Apps have a purpose. A report or dashboard may carry a title, but it is less common that they have a clear and specific purpose. A well-conceived analytical app knows the problem it is trying to solve and what data is necessary to solve it. In this way they are similar to the apps on your phone — they solve a problem the same way a mapping app shows you how to get to the Chuck E. Cheese and a weather app lets you know if you need to bring an umbrella.
2. Apps make data exploration easy. I’ve spent a decade railing against poorly designed dashboards that put the burden on users to find where to start, how to traverse the data, and what actions to take. Good analytics apps willingly carry that burden. Whether we call it “data storytelling,” narrative flow, or quality user experience design, the app should deliver a useful path through the data to make smart decisions.
3. Apps are collaborative. Most business decisions are made as a group. If that weren’t the case, you’d have a lot fewer meetings on your calendar. Why should data-driven decisions be any different? Historically, reports and dashboards treat data delivery as a broadcast medium — a one-way flow of information to a broad audience. But that’s just the start: the recipients need to explore, understand, and find and share insights. They should bring their own context to a discussion, then decisions should be made. Our belief is that data analysis should be more social than solitary. It is at the heart of the “discussions" feature built into our data storytelling platform, Juicebox.
4. Apps lead to action. "What would you do if you knew that information?” That’s the question we ask again and again in working with companies that want to make data useful. Understanding the connection between data and action creates a higher expectation of your data. Analytical apps connect the dots from data to exploration to insight to action.
5. Apps are personalized and role-specific. The attitude of "one size fits all" is typically applied when creating a dashboard or report, and then it is up to individuals to find their own meaning. Analytical apps strive to deliver the right information for each person. How? By utilizing permissions for a user to only see certain data, automatically saving views of the data, and presenting content relevant to the user’s role.
The mammals took over because conditions changed, and the outdated species — with its size and sharp teeth — couldn’t adapt. Expectations are changing the analytics world. Consumers of data want an experience like they enjoy on their mobile devices. They don’t have the attention to pour over a bulky, unfocused spreadsheet, and they expect the ability collaborate with their remote peers. The climate has changed, and so too must our approach to delivering data.
If you’re still churning out reports, we can help you do better. Or if you’ve constructed a one-page dashboard, we can show you a different approach. Drop us a line at info@juiceanalytics.com or send us a message using the form below.