
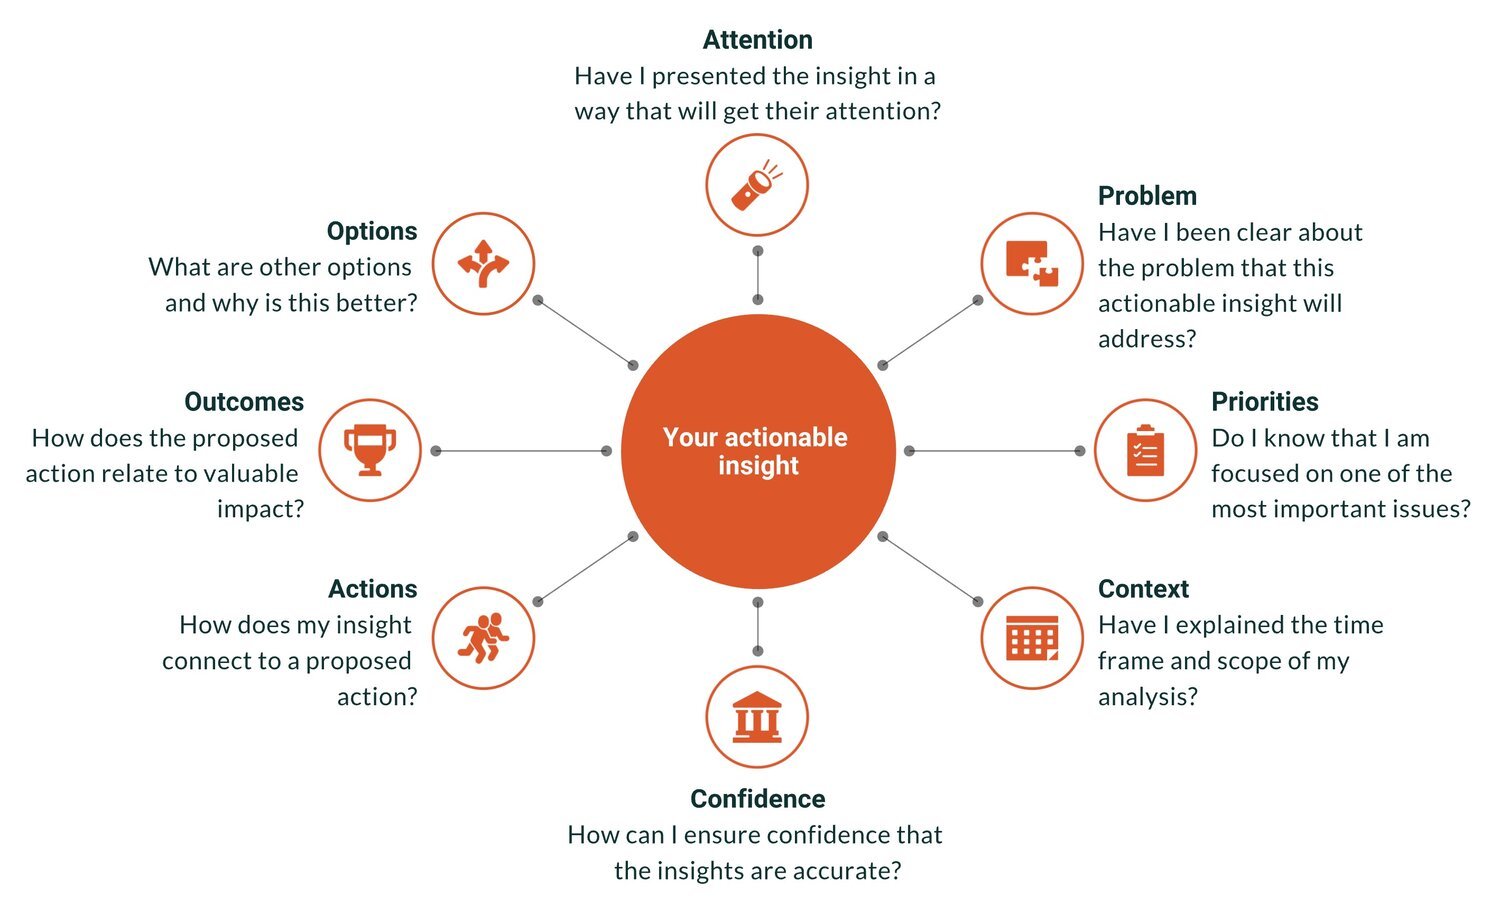
How to Ensure Your Actionable Insights Lead to Action
“Actionable insights” is the Holy Grail of analytics. It is the point at which data achieves value, when smarter decisions are made, and when the hard work of the analytics team pays off. Actionable insights can also be elusive — a perfectly brilliant insight gets ignored or a comprehensive report gathers dusts on a shelf.
7 Must-Have Data Visualization Skills for Data Analysts
When I speak to people new to the analytics field, they often wonder what skills will make them successful in their career. For all the data science skills, tools, and boot camps that are available, I still find that the missing link for many data analysts is the ability to communicate and convince after they’ve analyzed data. All your hard work is wasted if it doesn’t spur someone to change.

The Art of Data Storytelling
Data Storytelling is a powerful way to present data in ways that influence your audience. It is a skill that combines elements of artistic expression and structured methods. In this article, we will start by learning from the mindset of a leading storytelling organization, Pixar. Then we will discuss how to structure data stories to guide your audience through data.

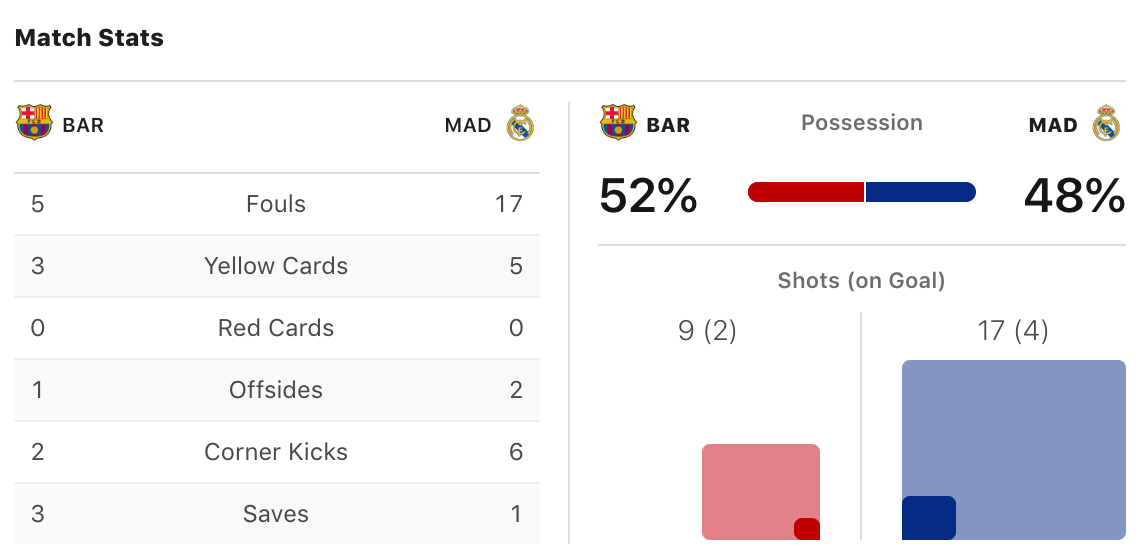
Data Discussion Lessons from Brad Pitt
Presumably, your data is not meant to distort, yet we can gather from this short scene some practical communication tips to improve data-informed discussions.
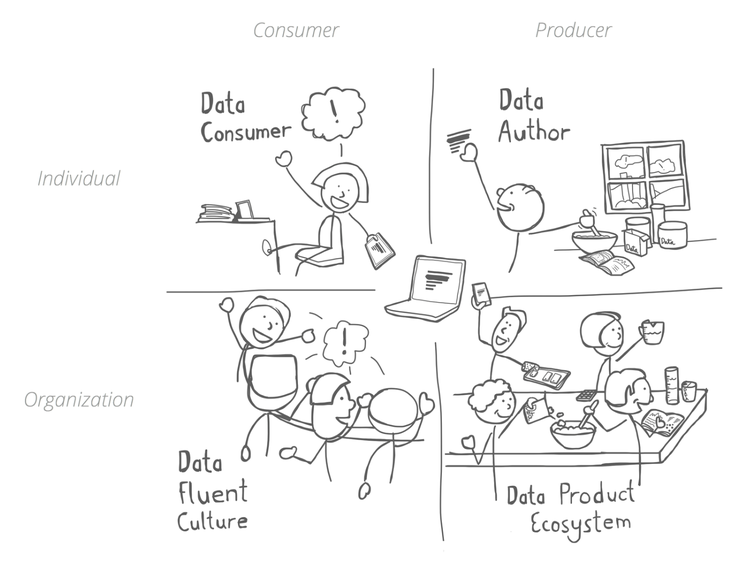
4 Components of the Data Fluency Framework
Data alone isn’t valuable—it’s costly. Gathering, storing, and managing data all costs money. Data only becomes valuable when you start to get insights from it and apply those insights to actions. But how do you empower your organization to do that?
Data Storytelling Checklist
Before you send off that data story or presentation, check out these eight guidelines to see if it is ready for prime-time.
12 Rules for Data Storytelling
Are you ready to learn how to be a data storyteller, but don’t have enough time to review the many great resources? Or maybe you don’t have the time to attend a world-class data storytelling workshop?

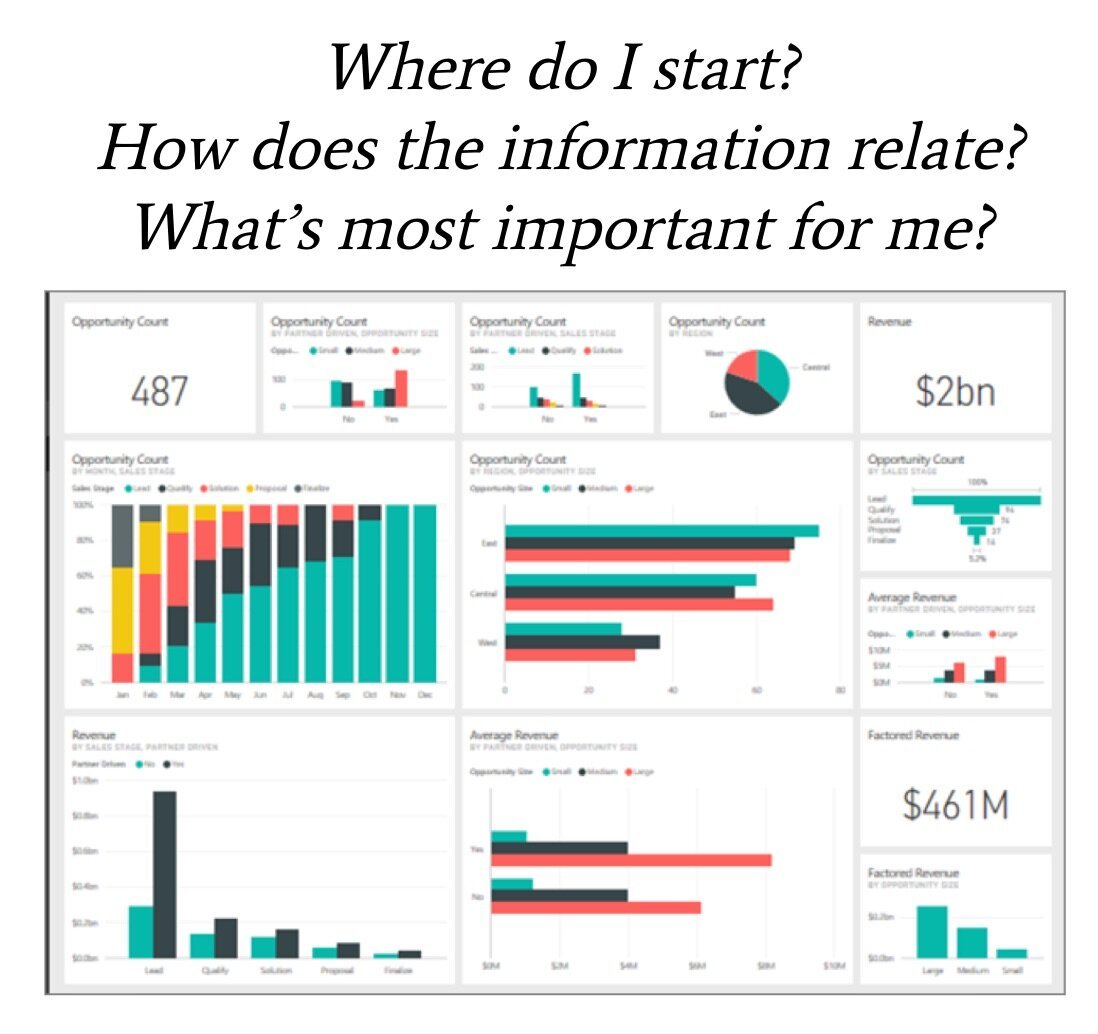
A Dashboard Alerts Checklist
The tendency with reporting, and information dashboard design in particular, is to cram as much information on the page as possible.
We offer tools to make data presentation as clear as possible (Juicebox, chart chooser). Sometimes clean isn’t enough; a more dramatic approach is needed.
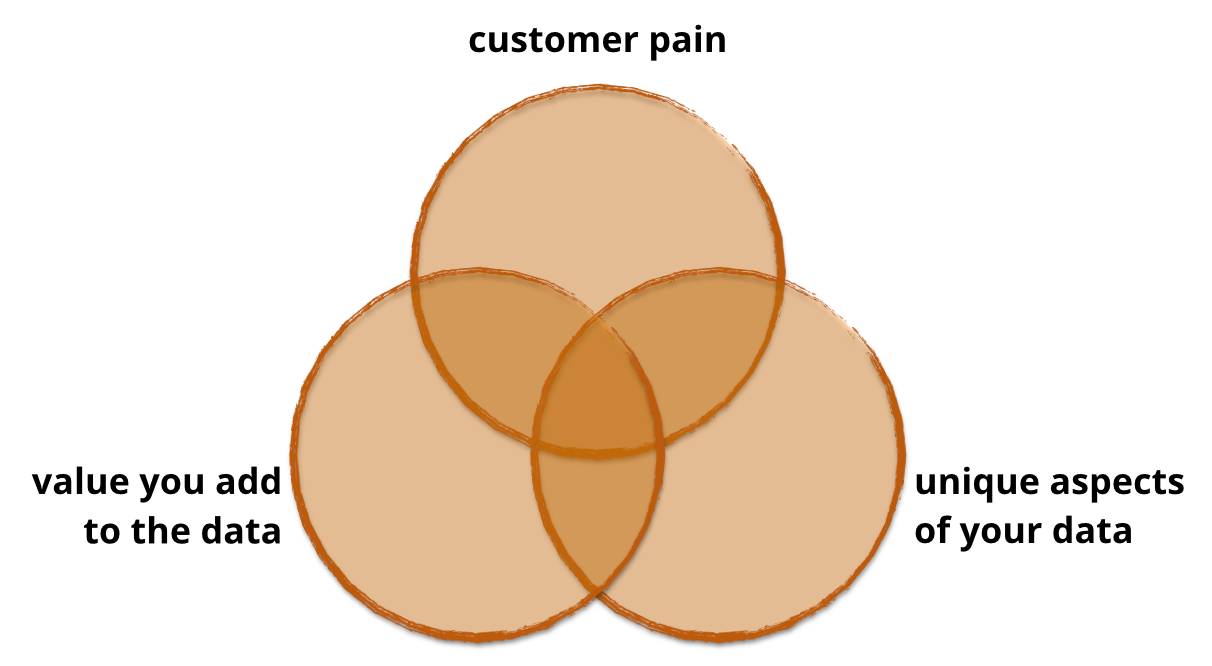
A Guide to Building Better Data Products
At Juice, we’ve helped our clients launch dozens of data products that generate new revenue streams, differentiate their solutions in the market and build stronger customer relationships. Along the way, we’ve learned a lot about what works and doesn’t. In this series I’ll take you through what you need to know to design, build, launch, sell and support a data product.
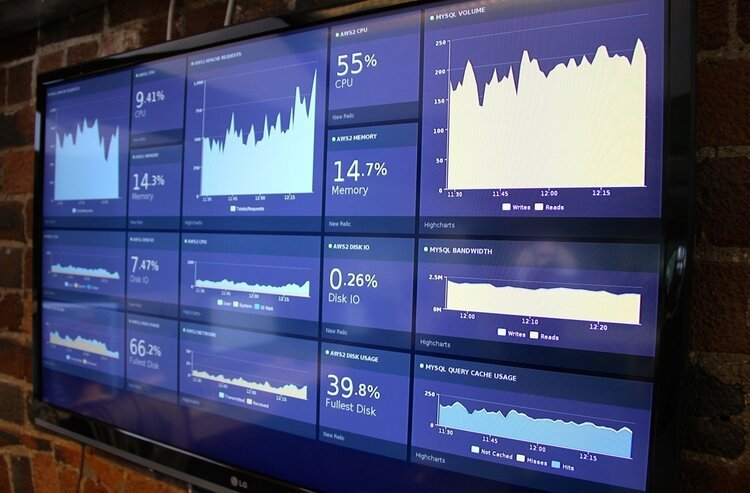
How to Create a Successful Real-time Dashboard
Real-time dashboards provide a single view to the most important performance metrics for an organization. Data exploration takes a back-seat to a focus on monitoring trends and progress to goals. Real-time dashboards show up on big screens in call centers, monitors in marketing departments, or the desk of a fictitious Private Equity titan on the TV show ‘Billions’.
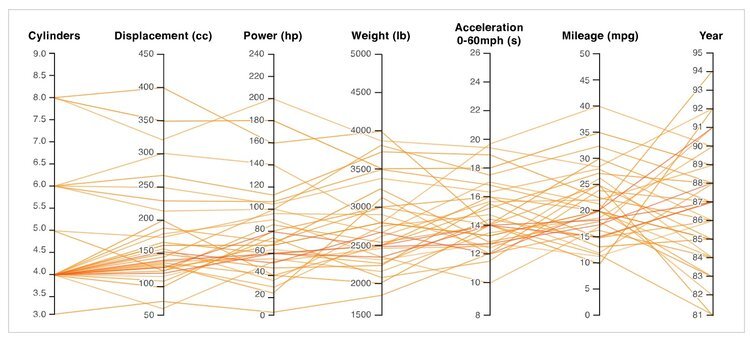
Better Know a Visualization: Understanding Parallel Coordinates Charts
Parallel coordinates is a visualization technique used to plot individual data elements across many performance measures. Each of the measures corresponds to a vertical axis and each data element is displayed as a series of connected points along the measure/axes.
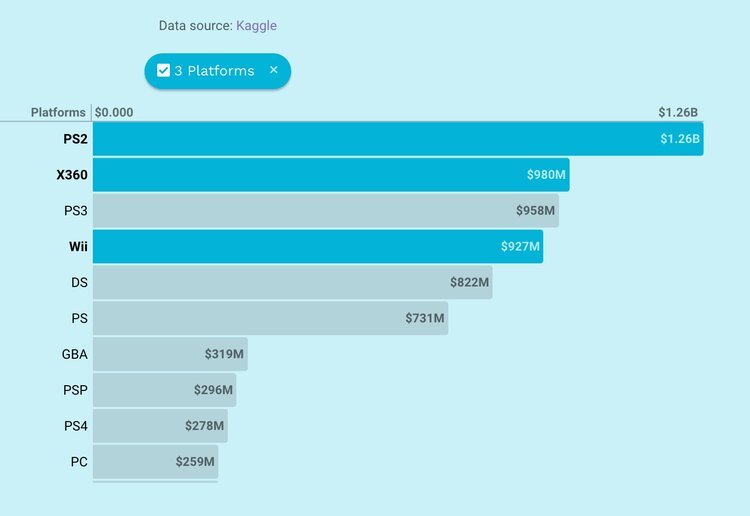
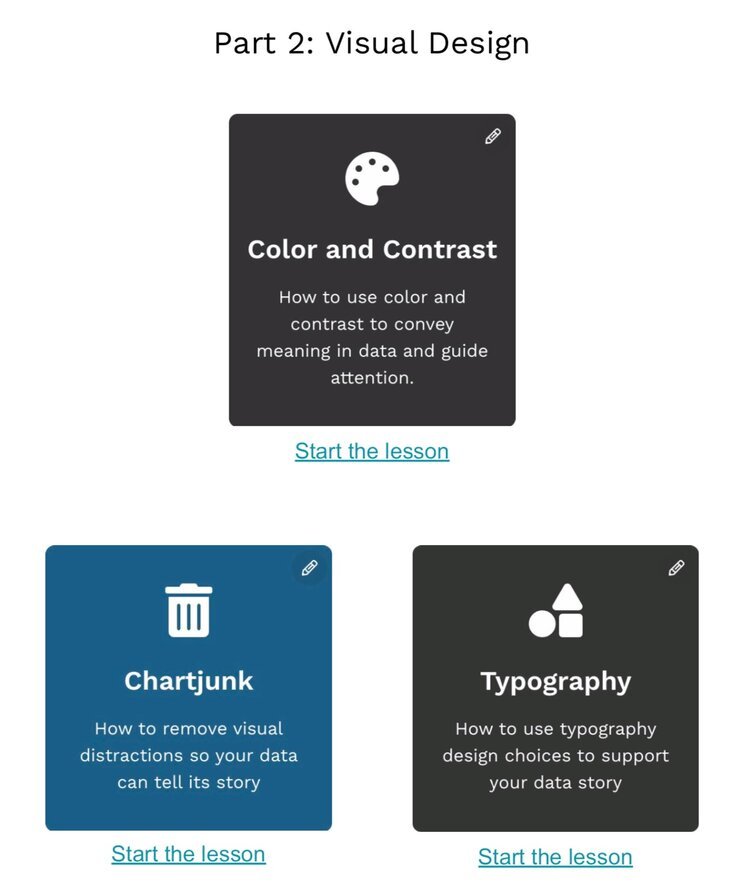
10 Ways to Improve Your Data Visualizations
Less is often more when designing your data visualizations. Here are ten lessons we've learned about how to better communicate with data. The key: give readers less information to absorb.
5 Rules for Successful Success Metrics
Here’s an analytics truism: everyone wants a dashboard (a.k.a. key performance indicators (a.k.a KPIs), success metrics, scorecards). Managers want a barometer of performance, a hammer to use on their subordinates, and a straightforward quantification of their business. Below are a few of the guidelines we use when we take on this task:
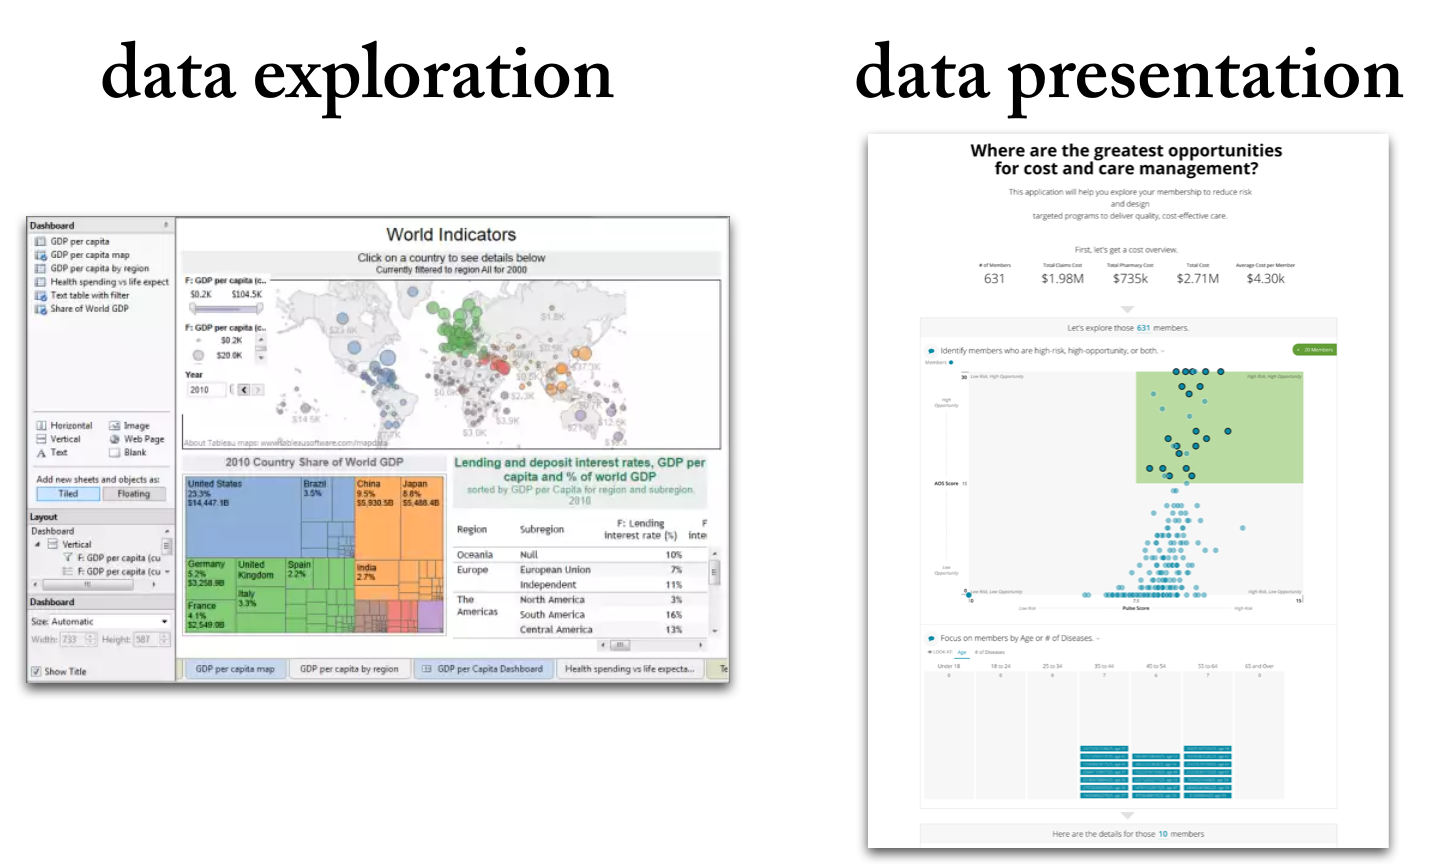
6 Differences Between data Exploration and Data Presentation
Data exploration means the deep-dive analysis of data in search of new insights.
Data presentation means the delivery of data insights to an audience in a form that makes clear the implications.
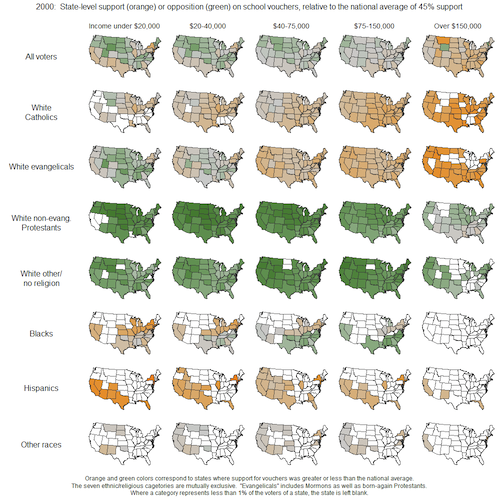
Better Know a Visualization: Small Multiples
(With enough visualization methods to warrant a periodic table, it can be confusing to know what to use and when—and which visualizations are even worth considering at all. This series of posts is intended to introduce you to the visualization approaches that we find most useful, practical, and audience-friendly.)
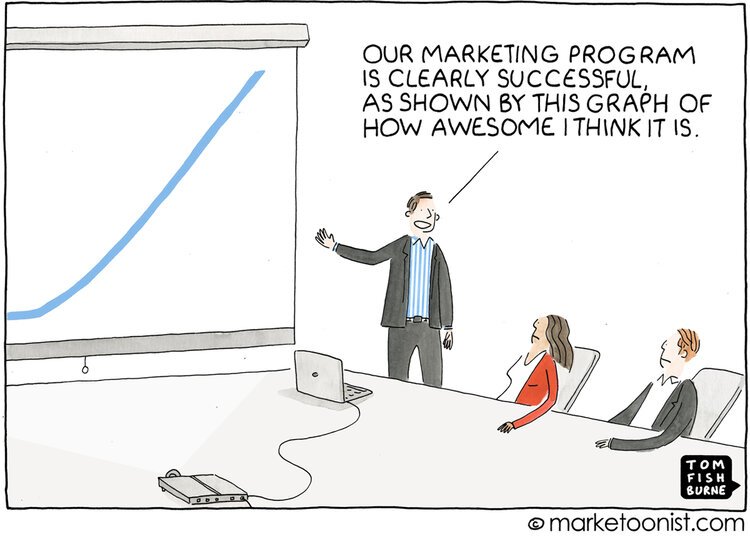
"If you are explaining, you are losing"
The title comes from Ronald Reagan, sometimes known as “The Great Communicator.” If he knew anything, he knew that simplicity was foundational when reaching a broad audience.
That doesn’t stop people from finding ways to overcomplicate their data visualizations. Take this example from The Data Viz Catalogue. It is called a Radial Bar Chart.

How do you build a high-impact analytics team? Jamie’s team knows.
It all begins with an idea.
Data Storytelling 2.0
It all begins with an idea.
The (Unfinished) Data Story
It all begins with an idea.

9 Lessons on Data Products
It all begins with an idea.