
Turning Raw Data Into Gold: A Modern Checklist for Data Product Managers
“Data is the new oil.” — everyone (first by Clive Humby)
“Treat data like money.” — Jim Davis (SAS CMO) in The Economist
You're likely sitting on a gold mine—raw, valuable data with untapped potential. But if you’re a data product manager, you know that refining this resource into something customers will actually use (and love) is no small feat.
At Juice Analytics, we’ve partnered with dozens of organizations over the years to create intuitive, actionable data products that people genuinely want to use. We’ve learned that the path from idea to successful launch is riddled with friction points—from unclear audiences to clunky user experiences to missing business models.
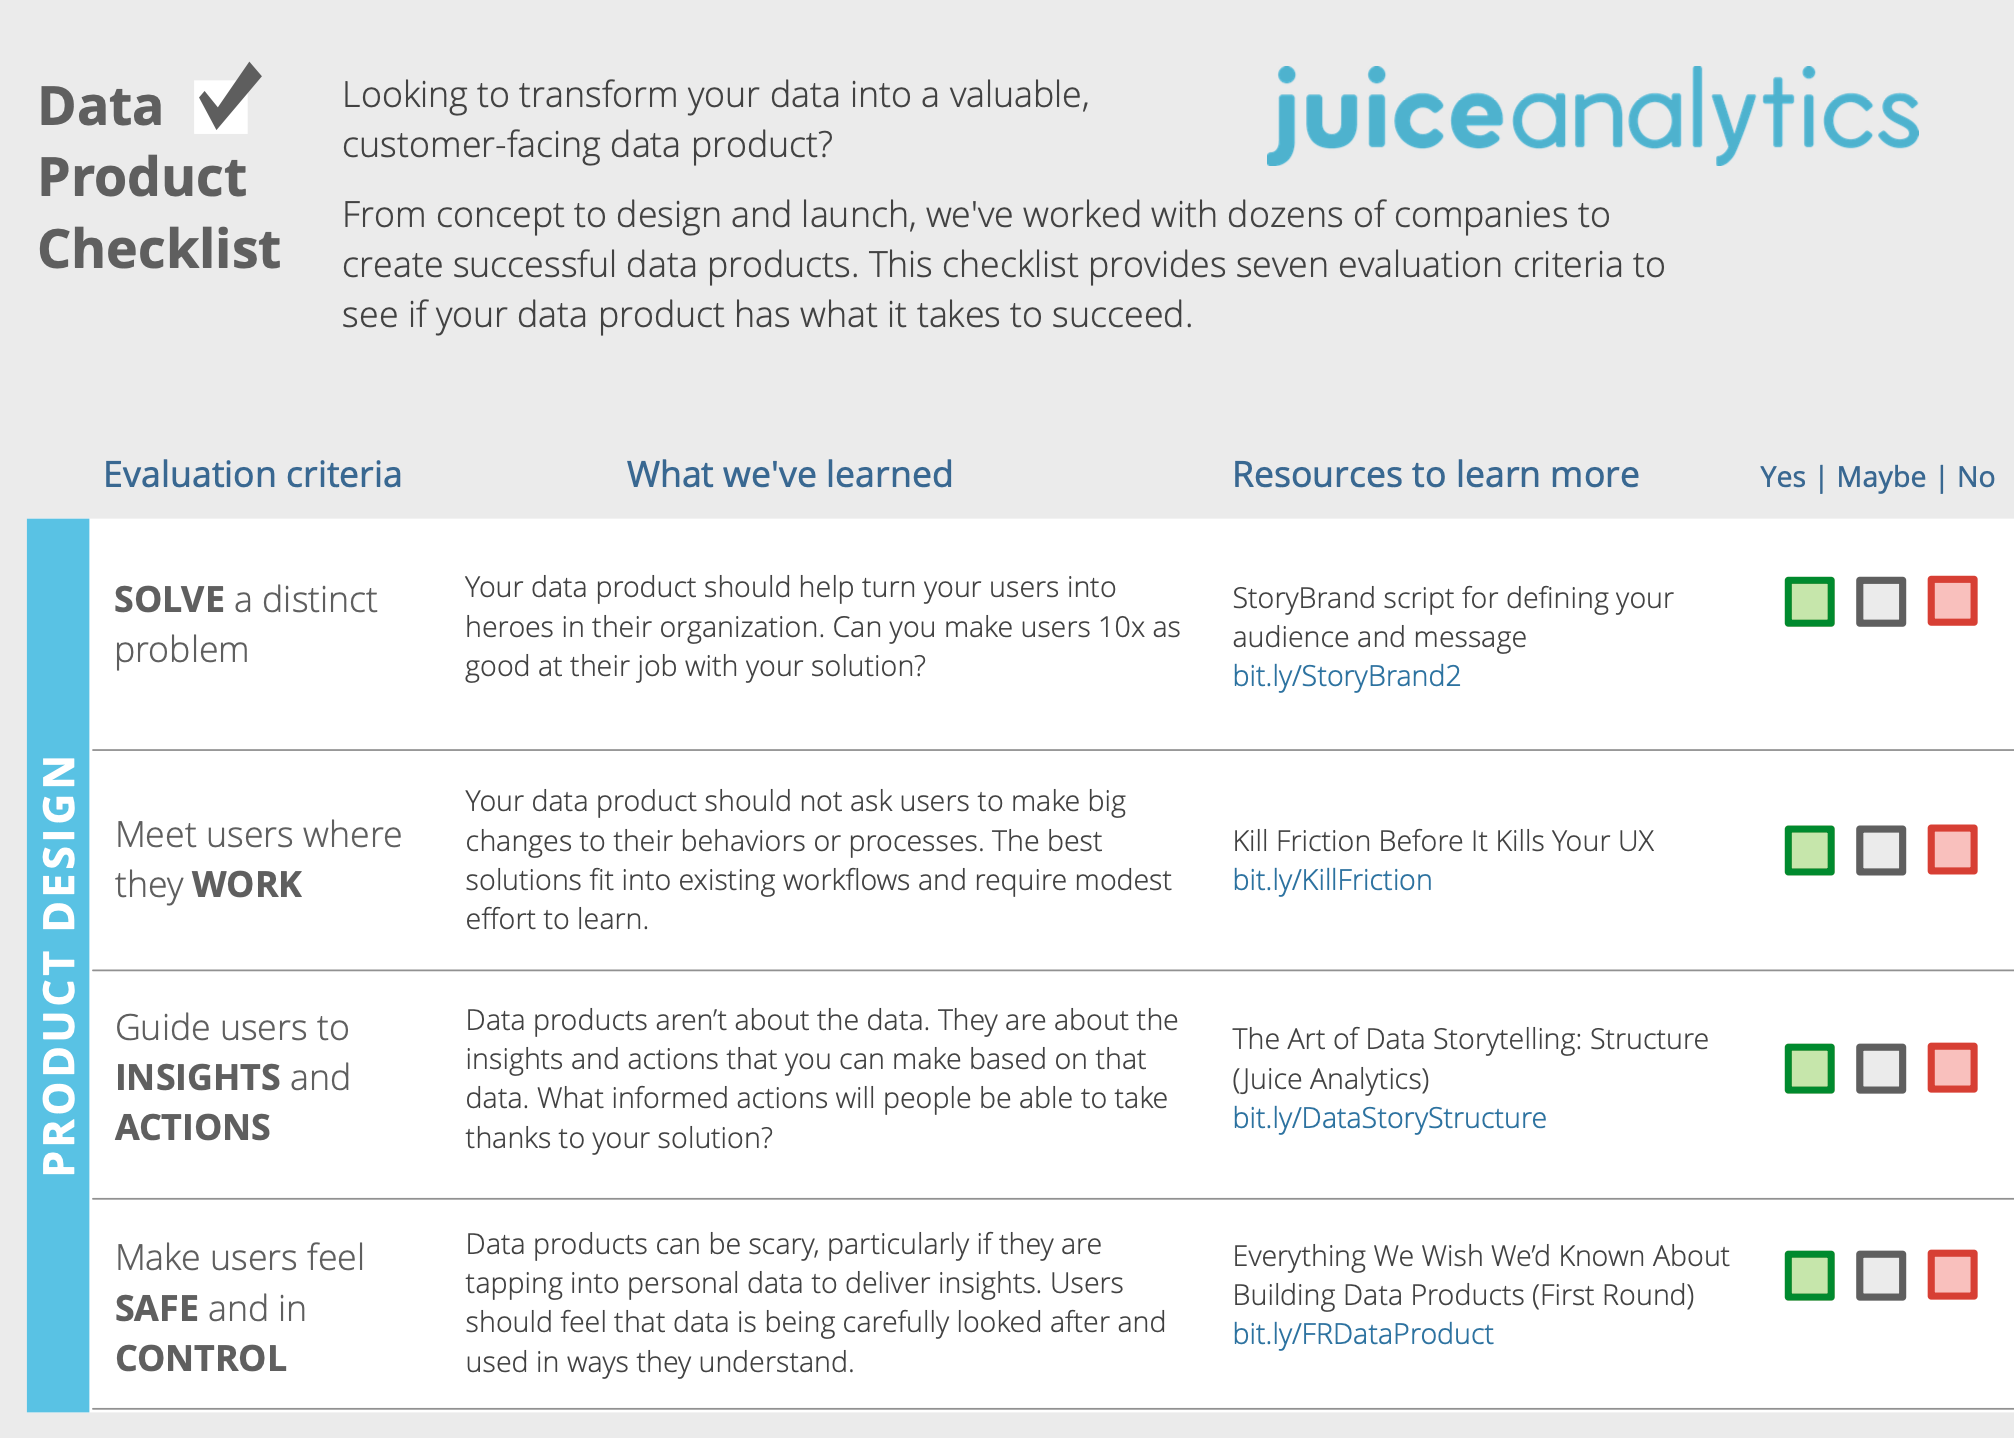
That’s why we created a Data Product Checklist, a tool for data product managers to use in the early stages of planning, designing, and delivering solutions. This updated 2026 guide takes those lessons further, adding industry context, helpful resources, and clear guidance along the way.
The checklist is divided into four key focus areas:
Audience – Who needs your data and why?
Data – Is your data usable, reliable, and meaningful?
Design – Are you solving a real problem with elegance and clarity?
Delivery – Can your solution scale, and are users set up for success?
Let’s walk through each one.
1. Audience: Know Who You’re Helping and How
Creating a powerful data product starts with empathy—understanding the end-user and what success looks like from their perspective.
Ask yourself:
Who is the primary user of this product?
What pain points are they experiencing today?
How can this solution make them look like a rock star in their organization?
Great data storytelling starts here. Before you visualize or design anything, create a “user story” that identifies goals, challenges, and decision points. The StoryBrand framework is a great tool to get clarity.
Checklist Prompt:
✔️ Does your product solve a distinct, high-value problem for a specific audience?
2. Data: Define It, Trust It, and Make It Work
Let’s be honest—your data isn’t perfect. But that doesn’t mean it can’t form the backbone of a great product. The key is to clean, enrich, and shape it for a specific purpose.
What to consider:
Is your data credible and bias-free?
Can you transform it into insights users can trust?
Are your metrics transparent and well-defined?
Related resource: 8 Ways to Determine the Credibility of Research Reports (EAIE)
Also, remember: data storytelling isn’t about dumping numbers into a chart. It’s about guiding users to the insights that drive better decisions. For help structuring this approach, check out The Art of Data Storytelling.
Checklist Prompt:
✔️ Does your product bring credibility to the data and make insights accessible?
3. Design: Solve Problems, Not Just Present Data
Dashboards are easy. Solving real problems with data? That’s much harder.
Strong data products fit seamlessly into a user’s workflow. They don’t ask for big behavioral changes. They guide users toward actions, not overwhelm them with visualizations.
Here’s what top-performing products do:
Meet users where they work. Embed into daily tools or processes.
Kill friction. Every extra click or unclear label erodes trust.
Prioritize usability. Simple is powerful. Smart defaults, helpful onboarding, and progressive disclosure go a long way.
Recommended read: Kill Friction Before It Kills Your UX (UXPin)
Above all, make users feel safe and in control—especially when personal or sensitive data is involved. Transparency about data usage builds long-term loyalty.
Tip: Check out Everything We Wish We’d Known About Building Data Products from First Round for real-world lessons.
Checklist Prompts:
✔️ Does your product guide users to specific actions or outcomes?
✔️ Is the UX low-friction, intuitive, and built into existing workflows?
✔️ Do users feel their data is respected and protected?
4. Delivery: From Launch to Longevity
You’ve designed a great product. Now what?
The real test isn’t whether it works—it’s whether it keeps working, at scale, under pressure, and with real users.
Operationalizing analytics means:
Your models and metrics update in real time (or near real time)
Your product can handle growing data volume and user load
You have a clear, repeatable delivery process
Resource: Productionalizing Machine Learning Models (Irina Kukuyeva)
And don’t forget about ongoing support. Data products are not "set-it-and-forget-it" tools. They need feedback loops, support structures, and community.
Helpful link: How to Create an Exceptional B2B Customer Experience (Hubspot)
Checklist Prompts:
✔️ Can you operationalize and scale your data product?
✔️ Is there a plan to support users post-launch?
How to Use This Checklist
We recommend using this framework as a self-assessment or team activity early in the development process. You can rate each of the seven key criteria as:
Yes = 1 point
Maybe = 0.5 points
No = 0 points
Score yourself:
6–7 points = Ready to launch
4–5 points = Fill in the gaps first
0–3 points = It might just be a fancy report
Wrapping It All Up: Build What People Actually Use
Too many data products never get adopted because they’re built from a “data first” mindset rather than a “user first” one.
If you focus on:
Understanding your audience
Enhancing data for clarity and credibility
Designing for action and adoption
Delivering support and scalability
…you’ll build a solution that tells a compelling story and truly solves a problem. In other words, not just another dashboard, but a data product.
Want help putting your checklist into practice? We’ve refined our own process for data product design based on years of working with companies to create interactive, high-impact solutions.
Happy drilling.