
11 Examples of Good & Bad Data Storytelling
11 Examples of Good & Bad Data Storytelling
With the popularity of our list of 20 Best Data Storytelling Examples, we thought it worth finding some more data stories for inspiration. The good examples in this list demonstrate how to combined data visualization, interactivity, and classic storytelling. They show the importance of a clear message, supporting data and analysis, and a narrative flow to engage the reader.
We’ve also included a few cautionary tales (look for the 👎) of data stories gone wrong. They offer a different kind of learning opportunity.
👍 Graphicacy & Cystic Fibrosis Foundation
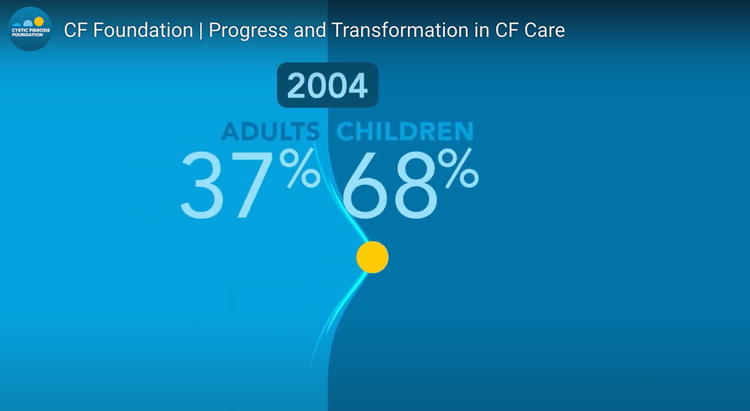
This data story combines pictures, voice-over, and animated data visualizations to create a compelling narrative. It demonstrates one of the many forms that data stories can take.

Using a database of 100,000 responses about “happiness moments”, Yau creates a data story that is largely exploratory. At the same time, he provides clear explanations and interesting examples from the data.

Hannah created a data visualization that tells of their interest in genres of books. (We couldn’t resist an example that uses stories to show data.) There is virtue in the simplicity and clarity of a short data story like this.

This award-winning marketing campaign used data to engage customers. It delivered a personalized story of their purchasing behaviors in a simple, direct summary. The relevance of the data story encouraged customer loyalty.

This beautifully rendered data story uses data to show how life has changed for different age groups. It excels with a clear statement of purpose, easy-to-follow flow, and repeated use of a visualization that perfectly fits the subject.
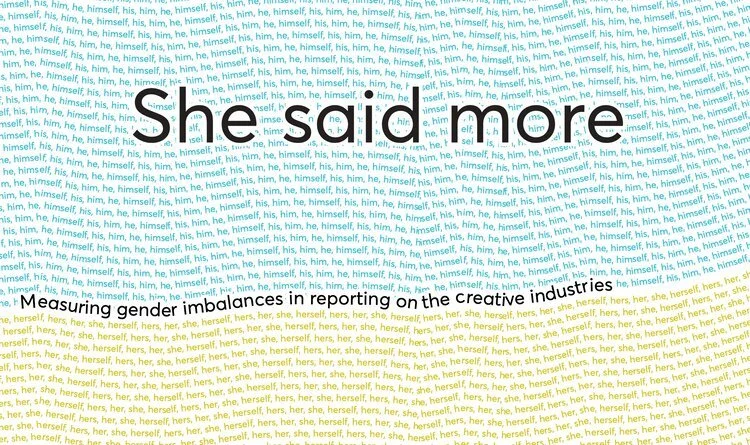
This data story looks at reporting references to women and identifies the large gender imbalances in areas such as technology, games, and creative industries. The purposefulness of this article is brought to life with creative visualization techniques.

This site’s innovative presentation design supports multiple perspectives on a complex topic. It features an explicit narrative about the data (spoken by the experts who researched it) alongside animated data visualizations.

This infographic provides a tour of the top restaurants in the world. Starting with context about Michelin Stars, it carries the reader through an interactive exploration of the types of cuisine, regions, and locations of these restaurants. Like any good data story, it concludes with an opportunity for action: book a reservation!

This is an example of a data story that is, in reality, simply a loose collection of facts on a topic. Closers to a collage than a story. In this case, the topic is plants — or gardening — and there is no core message or logical flow to the infographic.

There is a host of “what not to do’s” in this example. Pie charts can make it hard to compare values — and this visual underscores that point repeatedly. The use of color is overwhelming and arbitrary. And for all the effort put into this design, it lacks any focused message.

Good data stories clarify a topic. They help frame it, explain the magnitude, and provide meaning. This one does the opposite: It takes an interesting topic and makes it more confusing by bringing no organizational structure or visualization techniques. The reader is left to wonder what are the implications as a consumer, and why should I care.