30 Days to Data Storytelling

30Days-to-data-storytelling

30Days-to-data-storytelling

READ,DO,WATCH,PLAY

We learn best from a diversity of inputs. That's partly why our previous 30 days exercise sheet was such a huge hit.

It's critical for analysts and presenters of data to share information in a way that people just get it. Enter data storytelling - a magical elixir to all your data communication woes! Well, maybe not quite. But you should be aware of recent efforts using this timeless approach to deliver information so naturally - through stories.

That's why we've created 30 Days to Data Storytelling.

This exercise breaks down a structured (yet casual) introduction to data storytelling through a variety resources. We wanted to provide a diversity of depth and inspiration. Feel free to skip around or follow our 4 week sequence. Print it and post it near the water cooler or slap it to your virtual desktop.

Enjoy!

Visual Storytelling - a thing of the past

I spent quite a few summer vacations as a kid getting dragged around Europe visiting castles and churches.   It is definitely an experience that I’m more thankful for now than I was at the time.   One of the things that I loved most, even as a child, was seeing the stained glass windows.  I have strong memories of being in Notre Dame in Paris and watching the light come in at dawn or staring at the Chartres Cathedral windows for minutes without moving.

image by Tobyotter via Flickr

image by Tobyotter via Flickr

As a boy, it wasn’t the history, the architecture or an admiration of the faith involved to build these churches.  Those were concepts beyond my ability, knowledge or frankly interest at the time.  What I have come to realize only in the past couple of years is that the windows were meant for me. At the base level, I needed something that could grab my attention and hold it. What I have discovered is that from this standpoint, I am no different than the illiterate masses of the Middle Ages or Renaissance.

I discovered that hundreds of years ago, with a need to engage the European population and educate them on scripture, someone decided it wasn’t the job of masons, who built structures that would last for centuries, but storytellers and designers who could make kids, like me, stop and look.  This was the intent all along as stained glass windows were referred to as “biblia pauperum", which meant "poor man's bible".

Now, with two years under my belt at Juice and hundreds of churches visited, it is interesting to apply the history and beauty of stained glass windows to the field of data visualization and presentation graphics. I now have a better handle on the true value of a designer.  For “design” to work for me, in any type of artistic endeavor, the designer should make me feel that it was designed specifically for me and make it beautiful at the same time to help lengthen my otherwise short span of attention.

As the noise about data visualization and data storytelling grows, it is nice to see that current leading experts in the field also value (and have not forgotten) these 2 design principles provided by our European ancestors.

Consider these two examples:

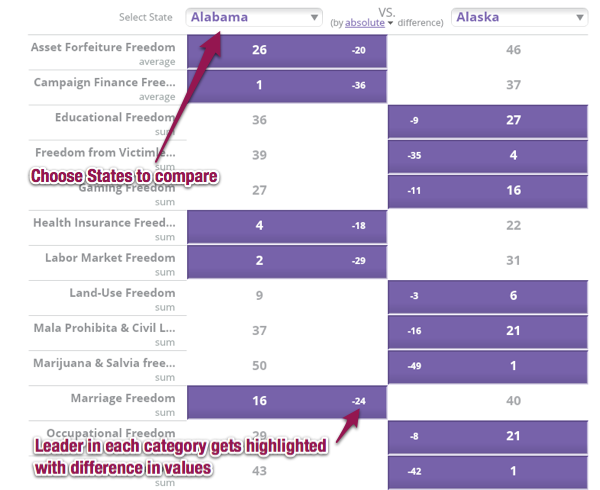
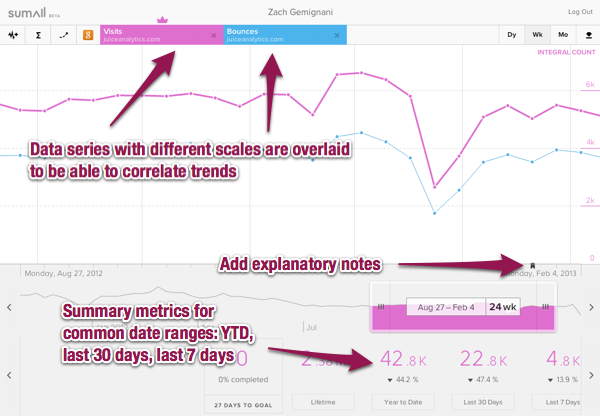
Design for your audience

  • In a recent blog dated 5/10/13, Stephen Few highlights this important customized approach as the 2nd of 7 tenets for best practices of quantitative Data presentations.

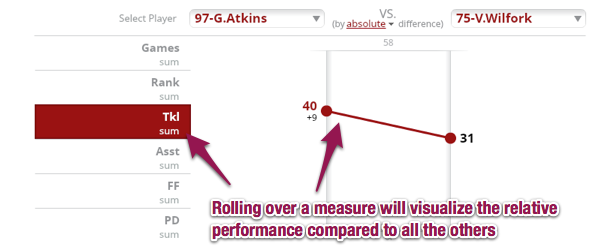
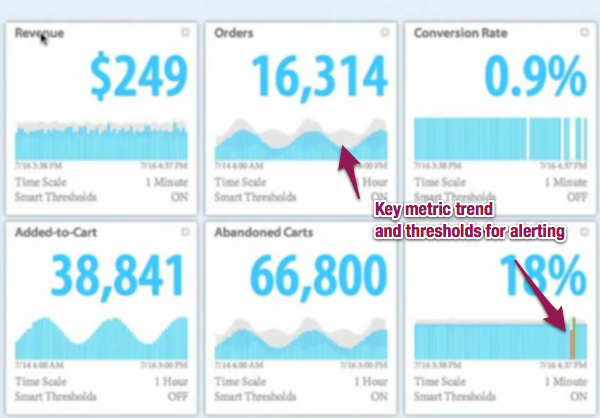
Beauty's role in dashboard design

  • Back in November of 2009, even before I joined the team, Juice published a frequently downloaded “Guide to Creating Dashboards People Love to Use”. The guide noted that “modern web design has moved on to seek a union of utility, usability and beauty. We must find a similar union when displaying data in business.” (bold and italics added)

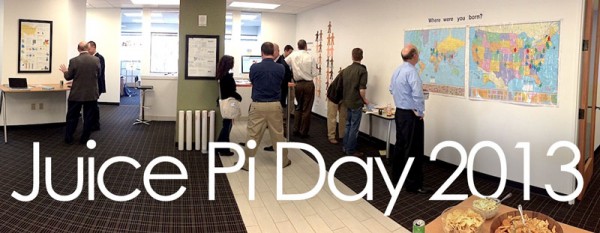
What will we learn from these impactful stories, built and told on stained glass sanctuary walls?  Will we preserve the most important principles found on those magnificent etchings? Today, our stories are accessed and downloaded from cloud-based applications and displayed in high resolution graphics on state-of-the-art devices. Yet our challenge is the same: capture the attention and imagination of our viewers – in a user-centric and aesthetically pleasing way.

Building Bridges from Academia to Business and Practice

Hey all – we have developed a great relationship with John Stasko, Associate Chair of the School of Interactive Computing program at Georgia Tech and the General Chair of the upcoming IEEE VIS 2013 conference. As we’ve talked with John, our conversations seem to always come around to the need for a tighter connection between academia and industry. As a result, we thought it’d be great to introduce John to our tribe through a guest post. Below are just some of the ways John is working to bring academia and industry together. Enjoy! 


Hello - I’m a professor at Georgia Tech and I’ve been working in the data visualization research area for over 20 years. My friends at Juice asked me to write a short guest blog entry providing perspectives from the academic data visualization community and exploring ways to foster more industry-academia collaboration. I’ve found that we don’t work together often enough, which is too bad because each side has a lot to offer to the other.

I personally have benefited from business collaborations in many ways. Since data visualization research is so problem-driven, industrial interaction provides an excellent way to learn about current problems and data challenges. In my graduate course on information visualization student teams design and implement semester-long data visualization projects. I encourage the teams to seek out real clients with data who want to understand it better. Some of the best projects over the years have resulted from topics suggested by colleagues working in industry. Additionally, I often employ guest lecturers such as the guys at Juice to come and speak with my students and provide their own insights about creating visualization solutions for clients.

I hope that in some ways my class is benefiting industry as well and helping to train the next generation of data visualization practitioners. Students learn about all the different visualization techniques and their particular strengths and limitations. They also get hands-on practice both designing visualizations for a variety of data sets and using current “best practice” tools and systems. The course has become a key piece of the Master’s degree in Human-Computer Interaction here at GT.

Another opportunity for interaction is academic research forums such as conferences and workshops. Coming up this October in Atlanta is IEEE VIS, the premier academic meeting for data visualization research. VIS consists of three conferences: Information Visualization (InfoVis), Visual Analytics Science & Technology (VAST), and Scientific Visualization (SciVis). Last fall, the meeting garnered over 1000 attendees for the first time.  VIS is an excellent forum to learn about the state of the art in data visualization research, see the latest systems from commercial vendors, and just rub elbows with like-minded friends and colleagues.  Recent papers at VIS presented tools such as Many Eyes and D3, introduced techniques such as Wordles and edge bundling, or just pondered topics such as storytelling and evaluation.  And the meeting has much more than just research papers – It also includes numerous workshops, tutorials, panels, and posters. This year for the first time we have added an “Industrial and Government Experiences Track”. This program is designed to highlight real world experiences designing, building, deploying and evaluating data visualizations. The presentation mode for this track will be posters on display throughout the meeting with multiple focused interaction sessions. Each submission should include a 2-page abstract about the project and a draft of the poster. They are due on June 27th.  More details about the track can be found on the meeting home page.

I hope to see many of you at VIS in October here in Atlanta!

Exercise your freedom to create interactive infographics

Freedom in the 50 States

Freedom in the 50 States is a very nice site showing how states compare along a variety of measures of freedom. Included in the list are your freedom to gamble, smoke marijuana, drink alcohol, have bachelor parties, and shoot off fireworks and guns. Note: please do not exercise all your freedoms at once.

The colored map and detailed drill-down show 37 measures, yet they forgot to include one important freedom: your freedom to communicate data with ease and create interactive infographics in minutes. Don't worry, we've got a heaping-helping of info-liberation. So before you send an angry e-mail to your congressman, take a look at what we put together with Slice in under an hour:

Slice version of Freedom in the 50 States

Like the Freedom site, we want users to be able to choose a metric and be able to see which states are freedom-loving and which are freedom-hating (I'm look at you, South Dakota, with your anti-bachelor party policies). That's our new "map slice" in action, which can color states based on our data or overlay colored bubbles to visualize locations.

To add even more data exploring fun, we created a visualization to let you compare two states side by side.  Check out how North Dakota totally dominates California on freedoms.

FreedomComparison
FreedomComparison

Having flexed my information visualization freedom muscles, I'm off to ride my bike without a helmet while drinking a 32-ounce soda.

Join us: Design and share a dashboard in 30 minutes

This week we are conducting a series of free (yes, free!) webinars to show how super easy it is to create an interactive, online report with Slice. You (yes, you!) are invited. If you don't think you have enough time...that's our very point. You probably don't have time to keep building those giant PowerPoint decks full for charts or 15Mb Excel reports. Spend a  little time with us, save a bunch of time with Slice. Choose a time below and sign up to watch our live webinar.

For the East-coast lunch-eating friends: May 1, 2013 12:00 PM EDT

For our West-coast lunch-eating friends: May 2, 2013 3:00 PM EDT

Mad Libbing your way to Purposeful Visualizations

Good data communication hinges on picking right chart. The patterns and insights almost magically emerge when you choose a chart or visualization that emphasizes the important elements in your data. Unfortunately, this is one of the biggest struggles for inexperienced presenters of data. I don't like to knock our own stuff, but a little healthy introspection is always a good thing. Consider our popular ChartChooser tool. In spite of it's carefully crafted name (it was core of an ad campaign akin to peanut butter: Choosy chart choosers choose ChartChooser -- no, not really), we've come to believe that ChartChooser isn't so useful for the "Chooser" part; it is useful because the "Chart" part is nicely formatted, downloadable PowerPoint and Excel charts.

Here are the filtering choices for ChartChooser:

ChartchooserFilters
ChartchooserFilters

I've been at this a while and I still don't always know how to connect what I'm trying to express with words as vague and broad as 'Composition' or 'Relationship'.

It isn't entirely ChartChooser's fault. Basic chart types are by nature broad and flexible in their usage. How can we make it easier for someone to make that leap from their question to a visualization that best answers it?

We believe one part of the solution is to make visualizations more purposeful. That is, create re-usable ways of expressing data that are carefully designed to answer common questions that people pose about their data.

While it's true that everyone's data is unique, what we've learned is that in most cases, the things they want to know about their data aren't so unique. The same sets of question patterns show up time after time. It's almost like a game of Mad Libs:

  • Which are my top performing _plural noun_?
  • Which _plural noun_ are the most significant outliers when measured by _ measure_ and _ measure_?
  • Which _plural noun_ have improved or declined the most over the last _time period_?
  • How does _singular noun_ compare to _singular noun_ across my important performance measures?

Our goal is to draw straight, obvious lines between questions like these and a visualization that directly and simply expresses an answer.

If you consider the last data Mad Lib question above, our match-up visualization is a good example: compare two things side by side to see relative performance. The Match-up was inspired by the traditional tale-of-the-tape graphics that you used to see in boxing matches.

Tale-of-the-tape
Tale-of-the-tape

Like a lot of our visualizations in Slice, we've added a number of key features that really help the user quickly understand and explore the data. Here are a couple examples:

Match-up1
Match-up1
Match-up2
Match-up2

We've put together a whole collection of these purposeful visualizations, such as a funnel visualization for sales conversions and other processes; a leaderboard for ranking top items across a bunch of measures (try it free here), and a comments visualization for reviewing and exploring survey verbatims, tweets, and other descriptions. And we'll be making more. What questions do you ask of your data?

Soccer needs some visualization love

Over the years you've seen a fewblogposts from the Juice Team on football, the American variety. We thought it made sense to give the world's most popular version of football a little love since the Major League Soccer (MLS) season just got underway. As we started our journey to pay tribute to the beautiful game, we came to realize much like the recent Sloan Sports Analytics Conference that fútbol is just starting to get its data on. Check out this view of team performance created in Slice.

MLS 2012 Season
MLS 2012 Season

This data comes from the MLS Soccer Team Stats page.

March Madness, Leaderboard-style

The Tournament is upon us. And if you know about picking a brackets, you know it comes down to match-ups, strong guard play, and choosing at least one 12-seed to beat a 5-seed. You also know the winner of your office pool will inevitably be that one non-basketball fan who picks teams based on mascots. Since we're bound for disappointment, why not have some fun with data. Our resident Iona grad, Michel, put together this slick Sliceboard that ranks the tournament teams by offensive and defensive stats. Notice how his school pours in 81 points a game as the 2nd most prolific offense in the tournament. They also manage to have the 2nd worst defense. Sorry Michel, defense wins Championships.

Offensive Leaders
Offensive Leaders

Juice Pi Day 2013

Juice Pi Day 2013
Juice Pi Day 2013

We’re not sure whether everyone came for the spread of pies or data visualization discussions, but either way the Juice 2013 Pi Day at our Atlanta office was a good time for all. As you can see, we decided to kick off the small talk visually.

Where were you born?
How many companies have you worked for since college?

With a wide variety of backgrounds, people could find a discussion area of their choice. Here are some topics we covered.

Data Storytelling

Data Storytelling is rising up the charts of trendy data visualization topics. I shared our thinking about what the term means to us (something we’d started with this blog post). Think of your role telling data stories like you are a safari guide. You can lead your audience around to see the most interesting sights in the park, but be willing to go off the planned course as the interests of your audience dictate. We pulled some lessons from Pixar’s rules for storytelling, discussed the importance of influencing both your primary audience as well as their audience, and connected these elements of data storytelling to how we designed Slice.

Meanwhile, next door...

Information Design Trends

We had an informal open discussion on trends we’ve seen and what they mean going forward. What are the challenges of responsive design to visualization; particularly as it relates to reporting vs. exploration. What does the rise of lifestyle data mean for the future, and for your privacy? There were generational differences in comfort with tracking with our younger attendees preferring to turn off and drop out. Finally, who doesn’t want to talk about “BIG data”? Is Hadoop for you? What will we do with the sextillion bytes of data (one billion terabytes) humanity will generate in 2013? How will this mountain of data get transformed into something people can act on and relate to?

In between, people cast their votes on these questions. What’s your answer?

Here are some notes and resources we jotted down. Feel free to add to them: http://bit.ly/JuicePiDayTrends

Thanks to all who came, and, if you couldn’t make it, join us next year!

6 Innovative Dashboards Worth Learning From

Dashboards can be dull. Four or six charts laid out in a grid. All data, no explanation or logical flow. In our white paper on dashboard design (PDF), I got a little perturbed at this model because it offers so little guidance to the reader. In hopes of sparking some new thinking, here are a half-dozen dashboards that demonstrate innovative designs and features.

1. ThinkUp: Dashboard as News Feed

ThinkUp
ThinkUp

This clever social media dashboard focuses on the changes and news-worth data updates. Each timeline element that flows down the page can be expanded to show details that supports the headlines.

2. SumAll: Trends, annotations, and goals

SumAllDash
SumAllDash

SumAll's recently released tool for trended business data is beautiful in its execution. The interface puts multiple metrics on the same chart to make it easy to see how trends correlate to each other (even though they are on different scale). SumAll does a nice job with allowing user-created comments, setting goals, and anticipating how users will want to read the data. If you design dashboards, it is worth signing up to absorb some of the nice design touches.

3. AppFirst DevOps Dashboard: Key metric trends and thresholds

AppFirst1
AppFirst1
AppFirst2
AppFirst2

This dashboard is a more traditional real-time operations dashboard. It shows all the key metrics together along with trends relative to goals.  AppFirst has some nice features that you can see in the video including 1) dropping metrics one on top of another to see correlated trends and, 2) "smart thresholds" to highlight points in the historical trends when the metric fell out of an acceptable range.

4. Analysis-One: Creative layout for easy comprehension

Analysis-One
Analysis-One

Many stoplight-style dashboards can be jarring to look at. This radial approach provides the high-level performance warnings in a subtle and pleasing way.

5. Square: Filtering

SquareDashboard
SquareDashboard

Mike Bostock of D3.js fame is the brains behind this dashboard for Square's retail sales. He used his Crossfilter approach for super simple and fluid filtering.

6. Tweetping and Tron, the Movie show us dashboards of the future.

If you want to build a dashboard with a style that will still work 20 years from now, check out the dark backgrounds, tiny fonts, and animation in these dashboards.

Tweetping
Tweetping
Tron Dashboard
Tron Dashboard

If you're interested in more well-designed dashboards, Quora has a good discussion on the topic here.