We’ve found 10 of the best options to automate and update data for recurring presentations.
The Challenge
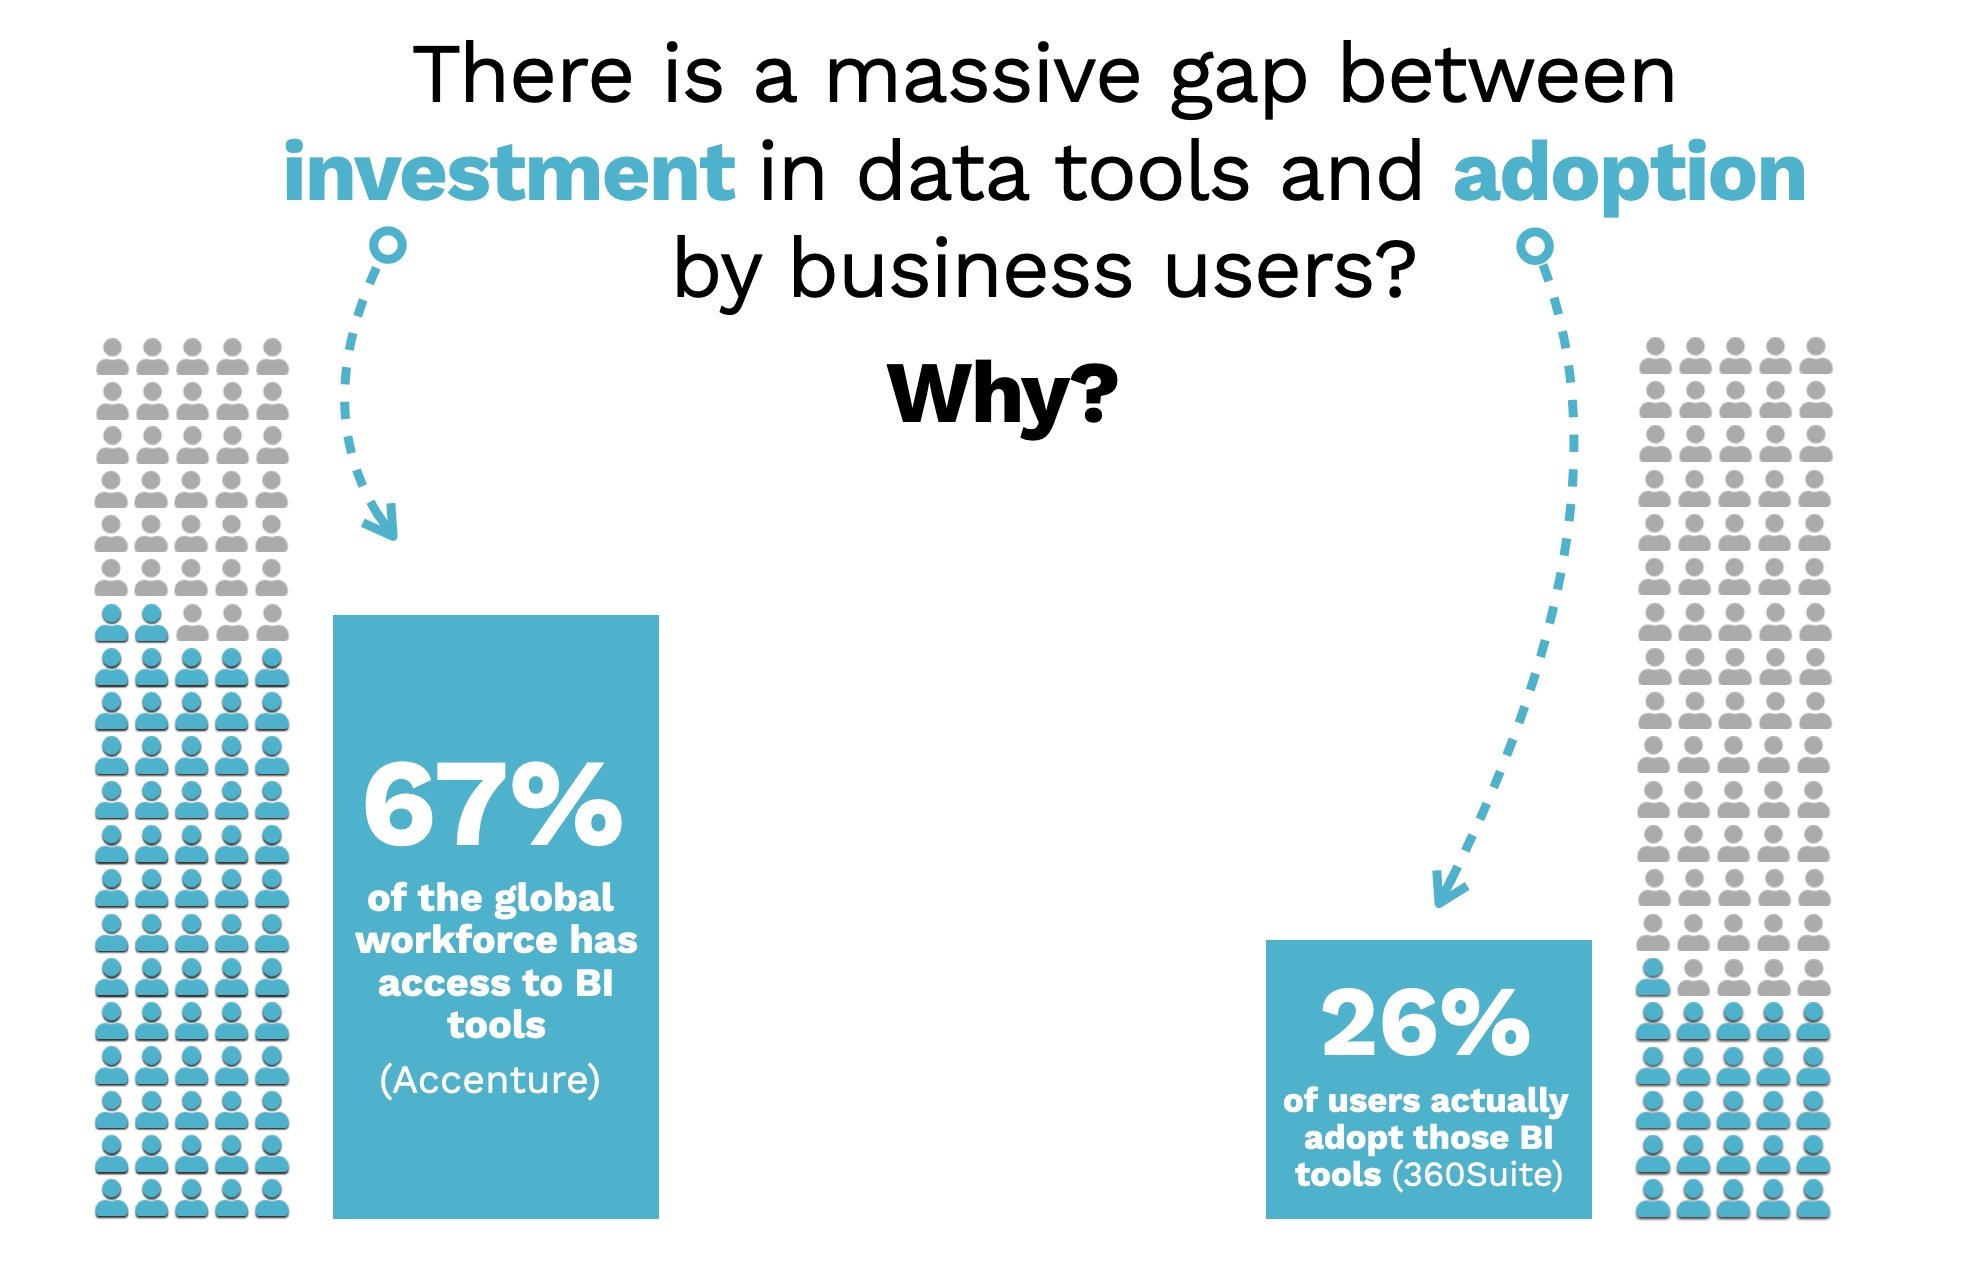
Let’s say you need to produce the same presentation month after month, updating the data each time. Or maybe you have a set of slides that need to go to a bunch of different audiences each with their own specific market, product, business line, or industry. While there are some tools available (see below), ultimately there are some difficult choices to make.
Updating all the slides by hand can be tedious, slow, and error-prone. The presentation is basically the same, you simply want to swap out the underlying data. You need something that acts like a "mail merge" for PowerPoint. There are a few things you want to consider as you evaluate your options:
Easy of use. Can you create your automated presentation workflow without technical expertise?
Efficiency. How easy and fool-proof is it to update your data? Will you need to check your presentations to ensure all the formatting worked as expected?
Audience needs and expectations. There are a variety of ways to deliver an automatically-updated presentation. Does your audience want the data to be interactive? What is going to be most convenient for them to review the results?
Cost. Is there an affordable or free solution to deliver this capability? Or will you need to get budget from your IT department?
Based on our research, there are a few paths to consider. First, you can choose from a variety of PowerPoint plug-ins that will allow you to connect your PowerPoint slides to different data sources and automate the generation of those slides (we’ve listed three such solutions below). Alternatively, you may consider web-based solutions to deliver your report or presentation. These options offer more powerful capabilities but may not come with the traditional joys of a PowerPoint document (five solutions below). Finally, if you are a developer, there are a couple technical solutions that allow you to construction the data integration workflows you need.
PowerPoint Plug-ins for Automated Presentation Generation
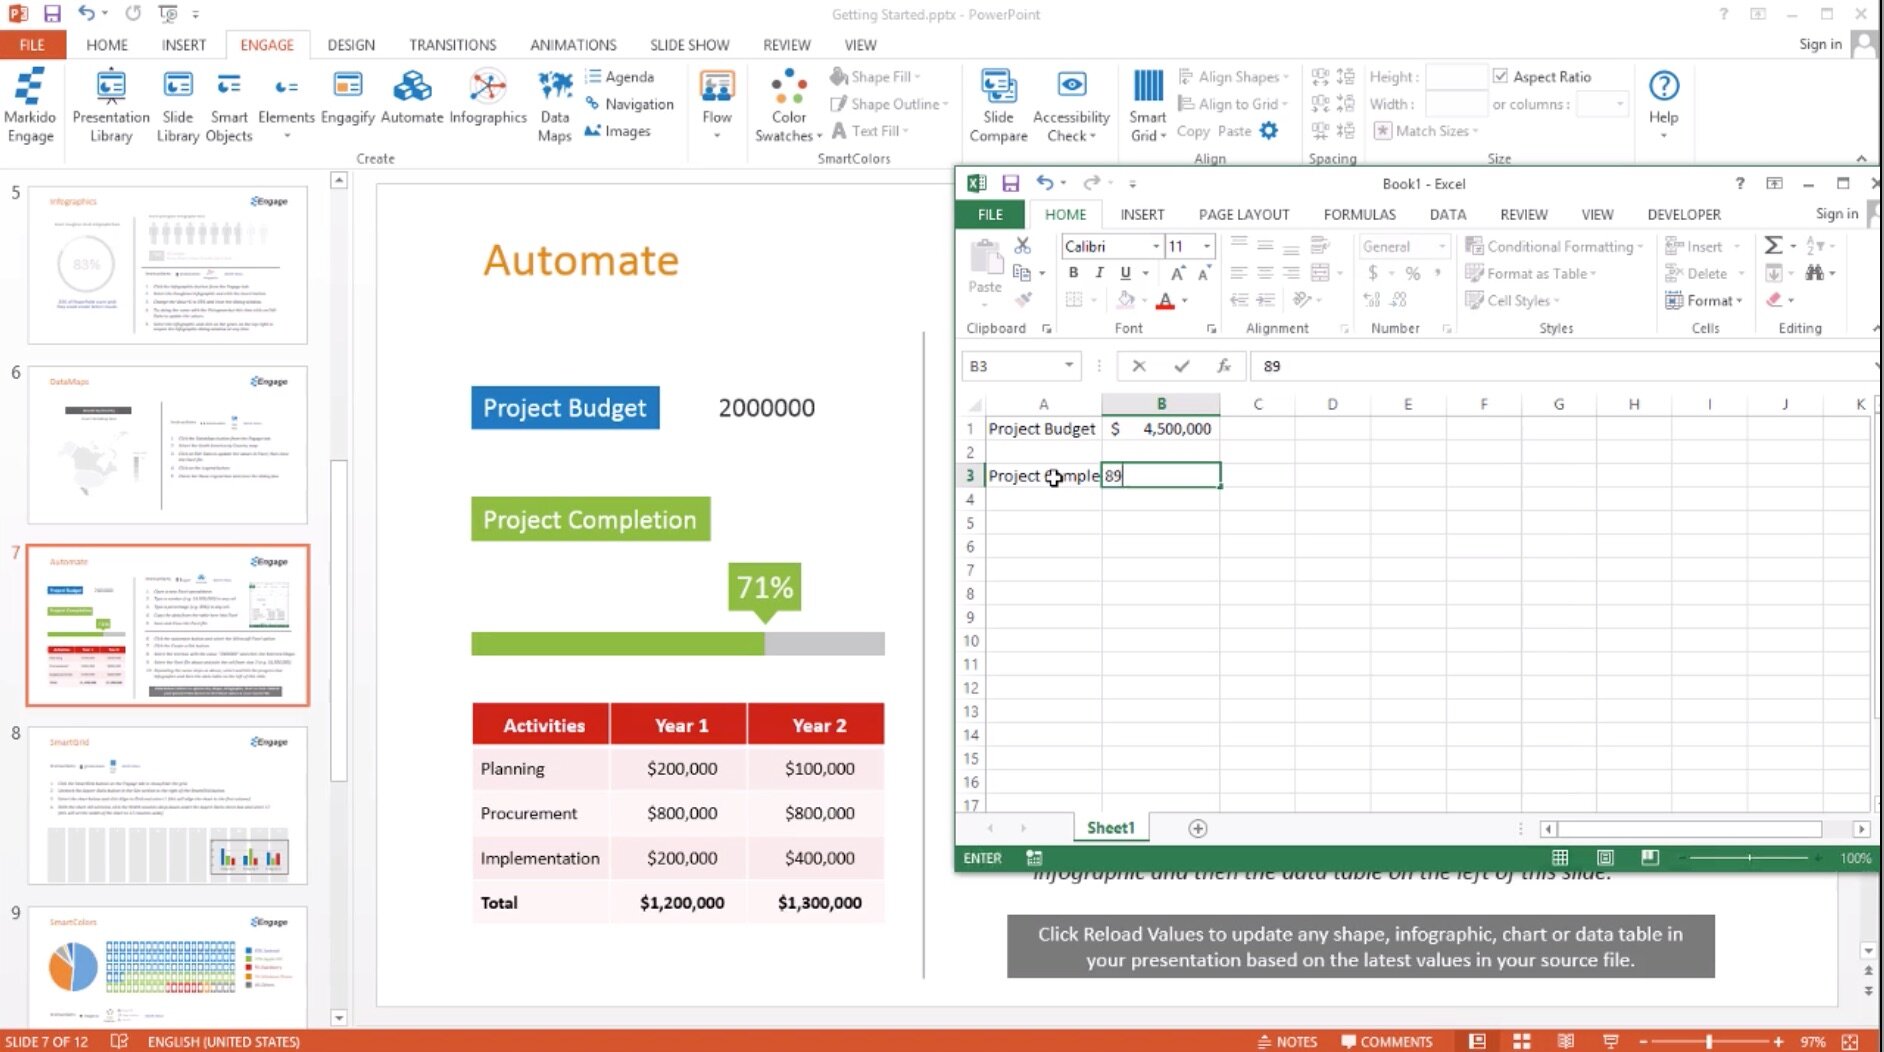
Engage by Markido
“Link shapes, tables, charts, images and infographics to MS Excel. When the source data changes you can update your whole presentation from multiple sources with just one click.”
In addition to the presentation automation features, Engage comes with a ton of other capabilities (e.g. maps, templates) for improving your PowerPoint presentations.
Cost: $29/user/month
DataPoint by PresentationPoint
“Do you want to save time and money with real-time linking your slides to data sources, instant data updates, and no more copy-paste errors?”
This time-tested product has a load of data connection and automation features to make you more efficient. See it in action in this video.
Cost: $29/month

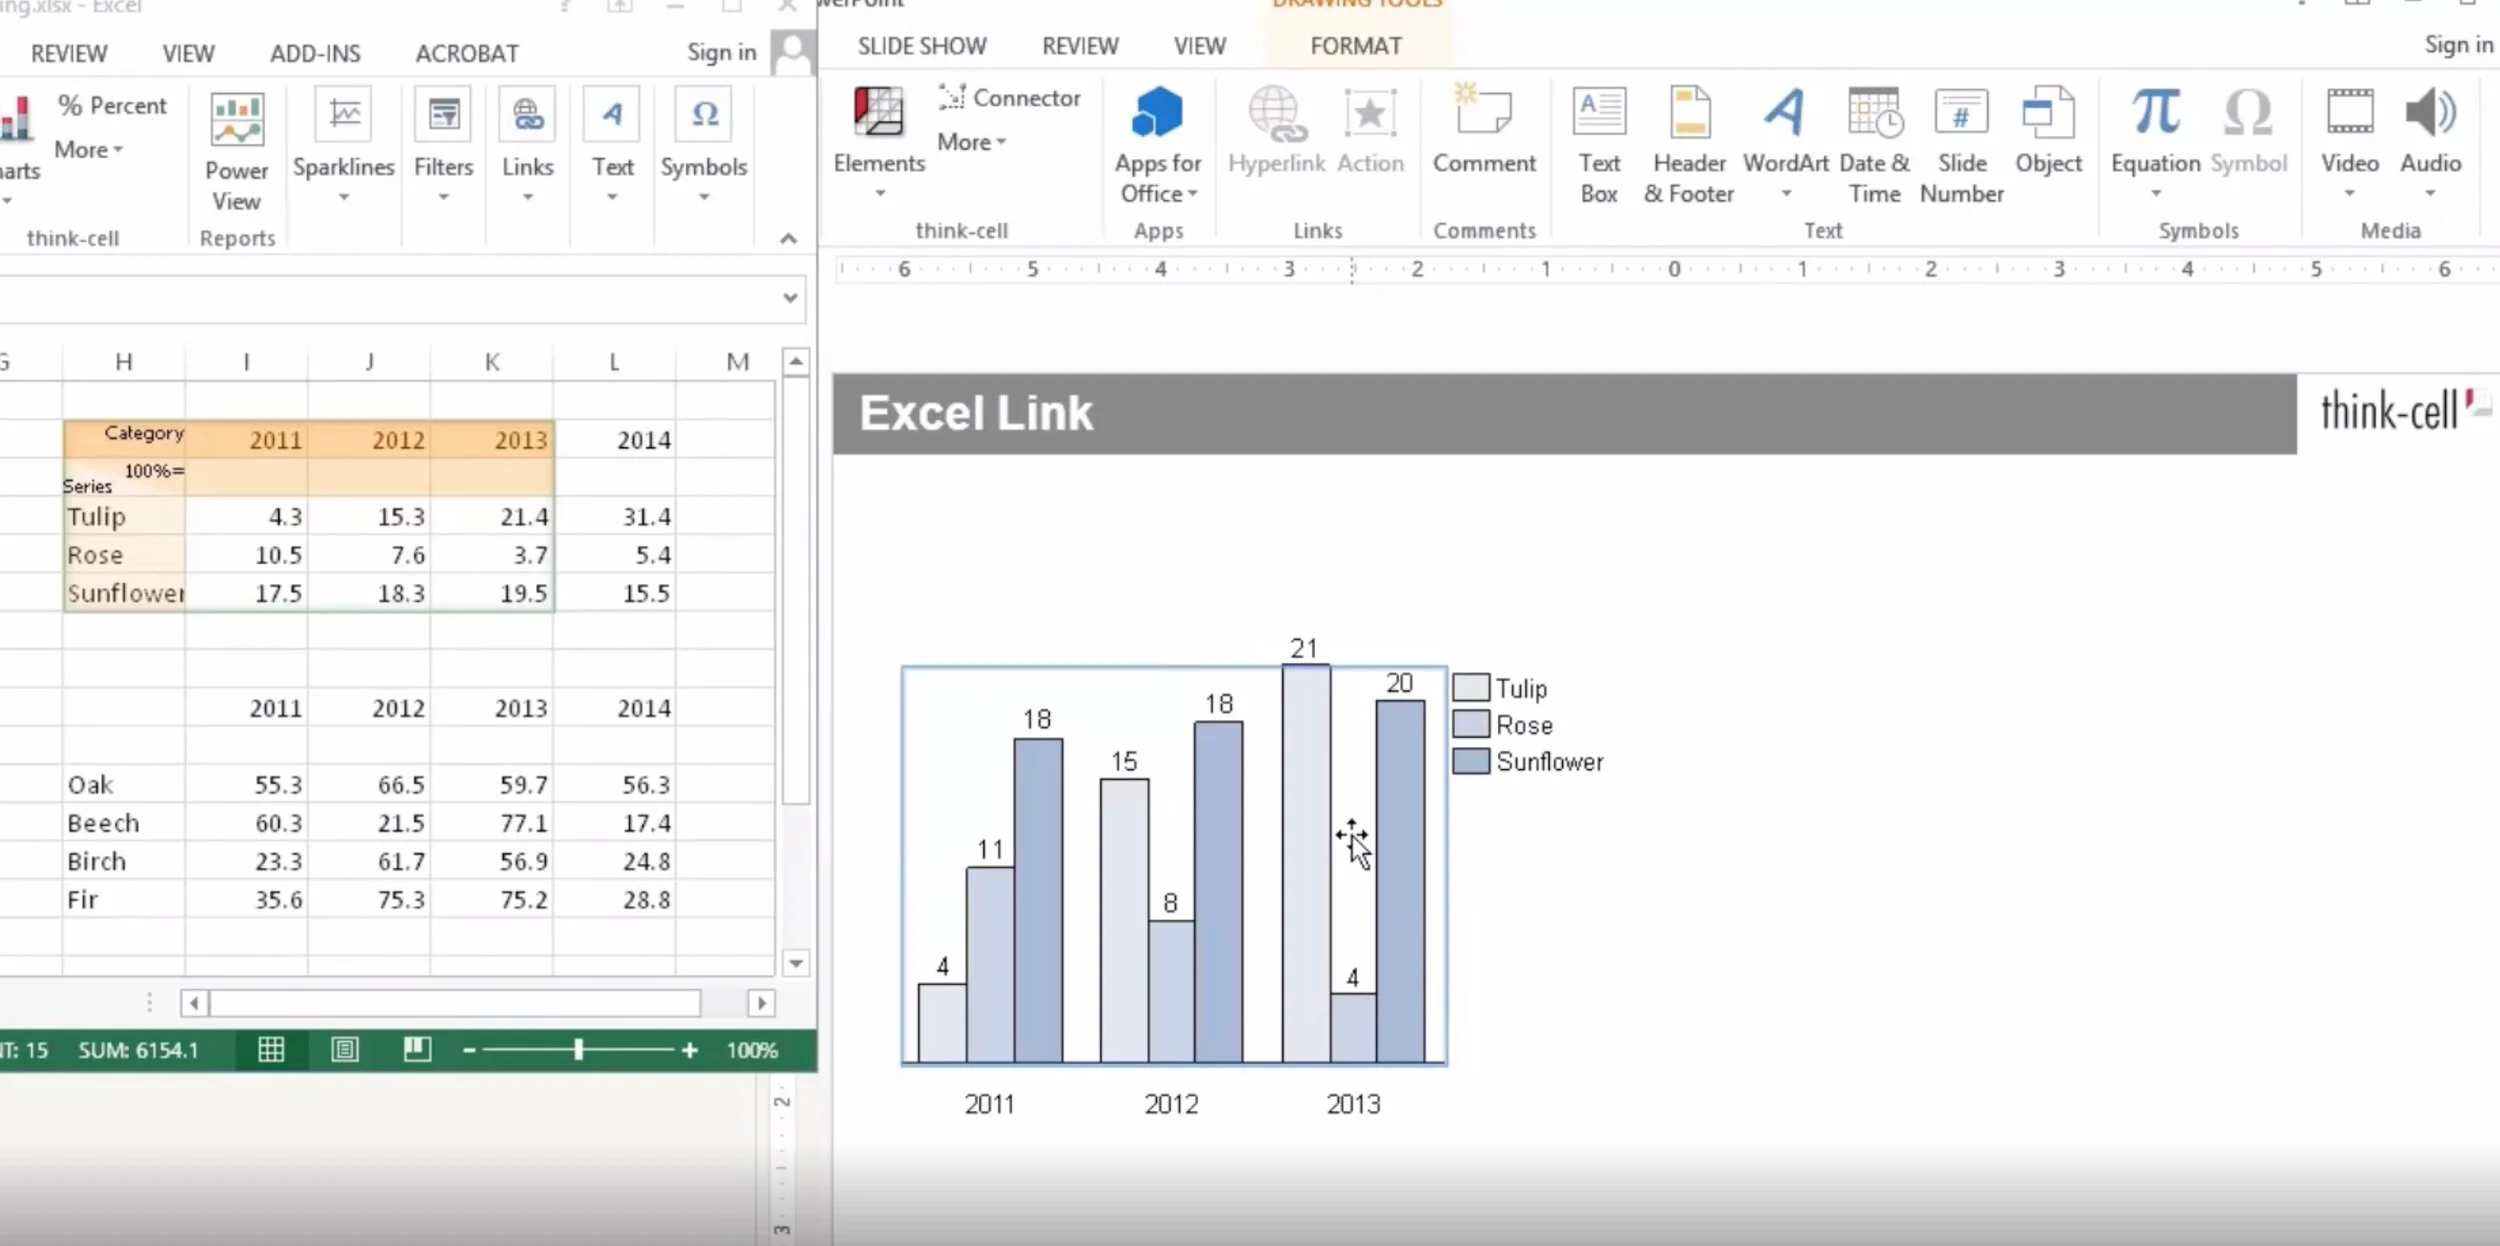
“It is a powerful charting and layout software that automates your PowerPoint work, improving slide creation efficiency and quality.”
Like other solutions, Think-Cell includes features for advanced charting alongside update automation.
Cost: Starts at $20/user/month
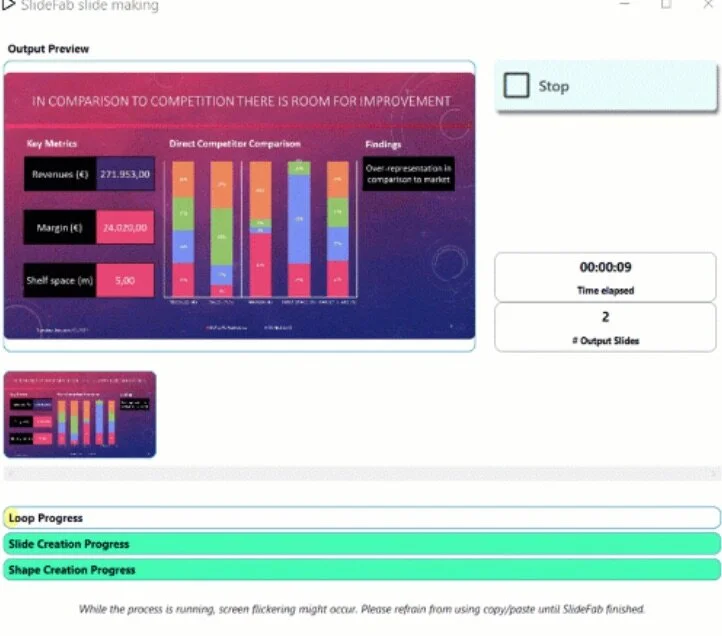
Similar slides, different content?Time to automate!
Mass-create individualised copies of PowerPoint slides
based on any Excel workbook without VBA coding.
Cost: $20/month
Web-based Solutions for Automated Presentation Generation
Juicebox by Juice Analytics
Juicebox is a web solution for creating interactive data-rich presentations.
Your “data stories” are as easy to create as a PowerPoint presentation but live on-line so they are easy to share and manage. Replace or update your data for your entire presentation in seconds.
Cost: Free for up to 3 users; $49/month for 5 editors.

“Experience the future of automated report creation. Connect your accounting software. Select a template”
Reach Reporting is a modern web-based tool which connects directly to your spreadsheets.
Cost: Starts at $149/month

Google Slides by Google
Google Slides is a free web-based presentation tool that can export slides as PowerPoint slides. Using this trick, you’ll be able to linked a Google Spreadsheet to your Google Slides and updated the data hands-free.
Cost: Free with a Google account.

“Flexible live reporting software built to make every stage of your analysis & reporting faster and easier.”
Displayr is focused on survey data, a common use case for recurring reports.
Cost: Free (for <20 docs, 1000 rows of data); $200/month
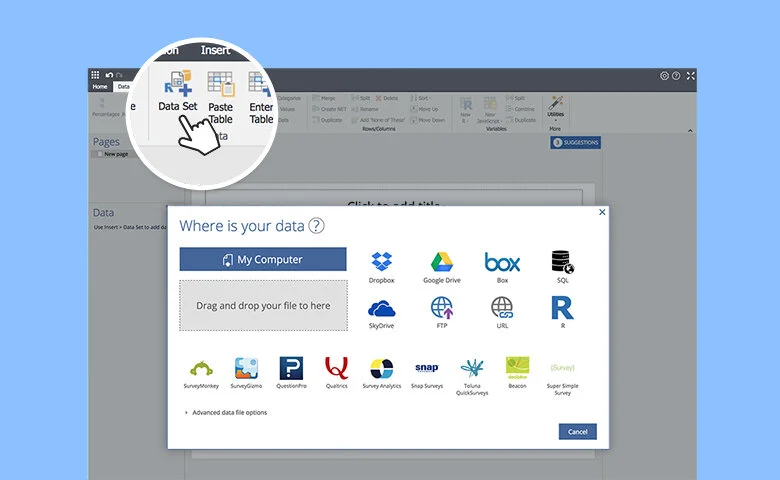
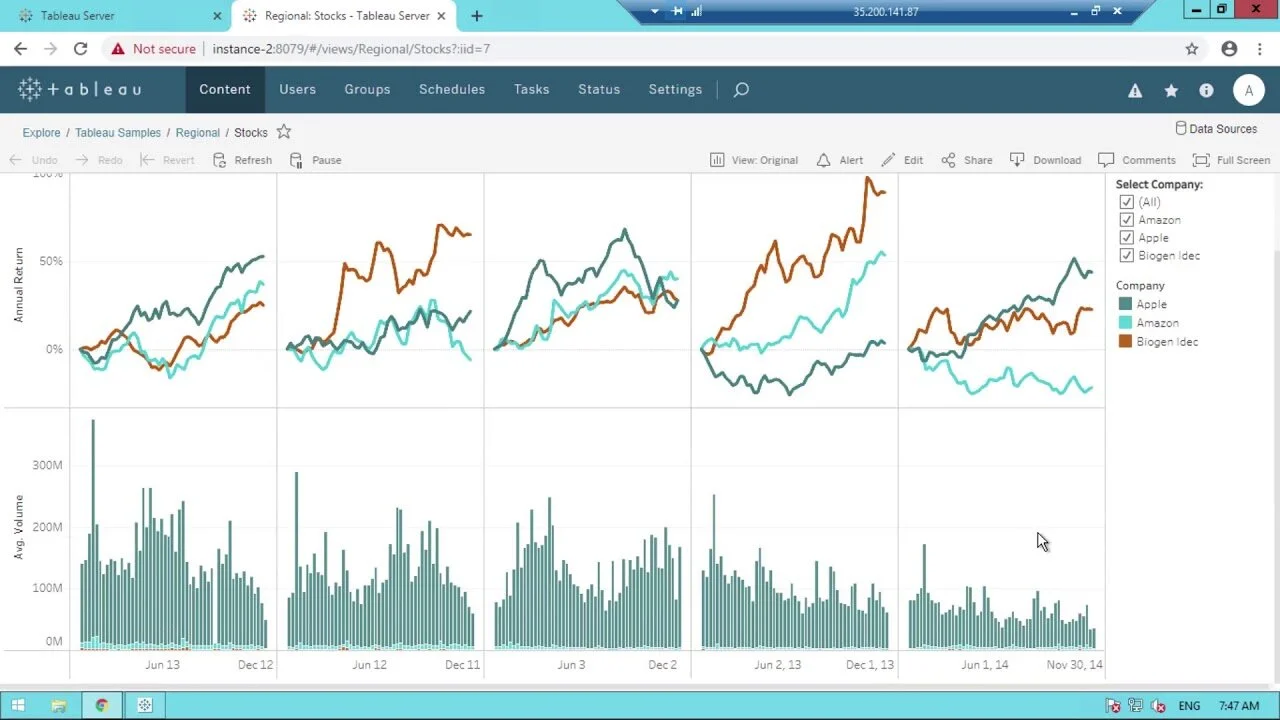
Tableau Software by Salesforce
This powerful visual analytics and dashboarding solution includes integrated features for exporting to PowerPoint. Turn your high-intensity visualizations into impressive slides.
Cost: $70/user/month
Developer Options
Finally, if you are feeling ambitious, there are some developer tools that will let you connect PowerPoint to your data sources directly.
PowerPoint Automation Toolkit: "With the PPTATK, PowerPoint becomes a best-case union of a presentation tool and a report writer. With the Tookit, you can build presentations which combine static slides from a slide library and data-driven slides which display charts, tables, and graphs from structured data sources."
Python PPTX: “python-pptx allows you to create new presentations as well as make changes to existing ones.”