
With enough visualization methods to warrant a periodic table, it can be confusing to know what to use and when—and which visualizations are even worth considering at all. This series of posts is intended to introduce you to the visualization approaches that we find most useful, practical, and audience-friendly.
What is a motion chart?
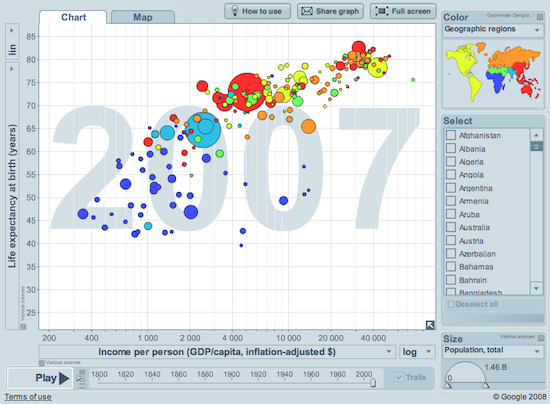
Motion charts are essentially animated bubble charts. A bubble chart shows data using the x-axis, y-axis, and the size and color of the bubble. A motion chart displays changes over time by showing movement within the two-dimensional space and changes in the size and color of the bubbles.
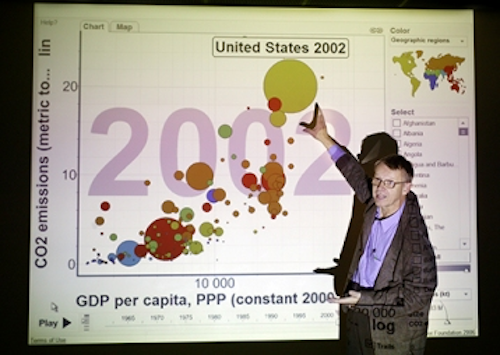
Modern-day motion charts were developed by an organization called GapMinder as part of a product called Trendalyzer. Hans Rosling, one of the founders of GapMinder, popularized the motion chart visualization in a much-admired TED Talk.
Motion charts can include a number of features, including:
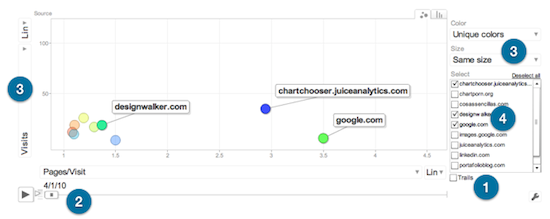
"Trails" to trace the path of individual bubbles
Animation bar to control the time range and animation
Selectors to define the metrics shown on the axes, bubble size, and color
Show/hide labels
What problem does this solve?
Advanced visualization methods exist for three reasons:
To show more dimensions of data simultaneously, therefore revealing more interesting stories in the data
To show high-level patterns as well as the individual elements that make up the pattern
To dazzle viewers
Motion charts accomplish all three. First, it brings the time dimension into a chart that would otherwise represent a snapshot in time. Motion charts can help in analysis if you find that you are asking yourself, how did I get here?
Secondly, Hans Rosling’s talk beautifully demonstrates the ability to see big picture patterns (flows of bubbles from one quadrant to another) while also focusing on the individual components. Finally, motion charts are sexy because stuff moves around the screen.
What to watch out for when using motion charts?
The masterful hands of a pro like Hans Rosling make motion charts look powerful and intuitive. Tiger Wood’s Phil Mickelson’s golf clubs are only a small part of what makes his game look so good. Effective use of motion charts can be tricky:
As an analysis tool, motion charts ask a lot of our visual pattern recognition skills. Bubble floating around in all directions, changing size and color can overwhelm many people. Hans Rosling had a clear story to tell. He also was able to narrow the data, metrics, and scope of his visualization to support his story.
Animation isn’t ideal for showing trends. Displaying trails can help, but is still inferior to the simple readability of a line chart. Don’t take my word for it: research shows that animation is not great for showing changes over time.
Animations also don’t transfer to static images--like that PowerPoint presentation you need to deliver to your boss.
Resist the temptation to cram in one more layer of data. Take this blog post comment for example:
"Great bubble chart solution. I’ve been looking for a 3D bubble chart so I can move bubbles in 3D space, allowing me to track an additional dimension. Any ideas?"
I’ve got an idea: Don’t do it!
Motion charts in practice
GapMinder shows a variety of public data sets using motion charts
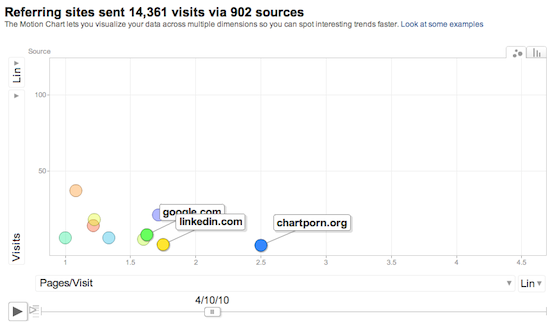
Google Analytics has built motion charts into their interface to visualize visitor and traffic patterns.
Do it yourself in Excel
Anand has a very helpful blog post about Motion Charts in Excel, including a sample excel spreadsheet.
Jon Peltier has a first and second-generation spreadsheet for motion charts.
Do it yourself with other tools
Google motion chart gadget is a flash-based widget that can be used in conjunction with Google Spreadsheets. More instructions here.
Google’s Public Data Explorer offers tons of data sources visualized using motion charts.
TrendCompass is a complex Flex-based motion chart tool. It offers all the functionality of the Google Gadget (and more), but little of the usability.
Tableau Public can create bubble charts with the ability to "scroll" through time.
More resources
GapMinder where all the motion chart goodness began
Mastering Motion Charts by Google Analytics


