
Rainbow in Cooperstown - June 3, 2012
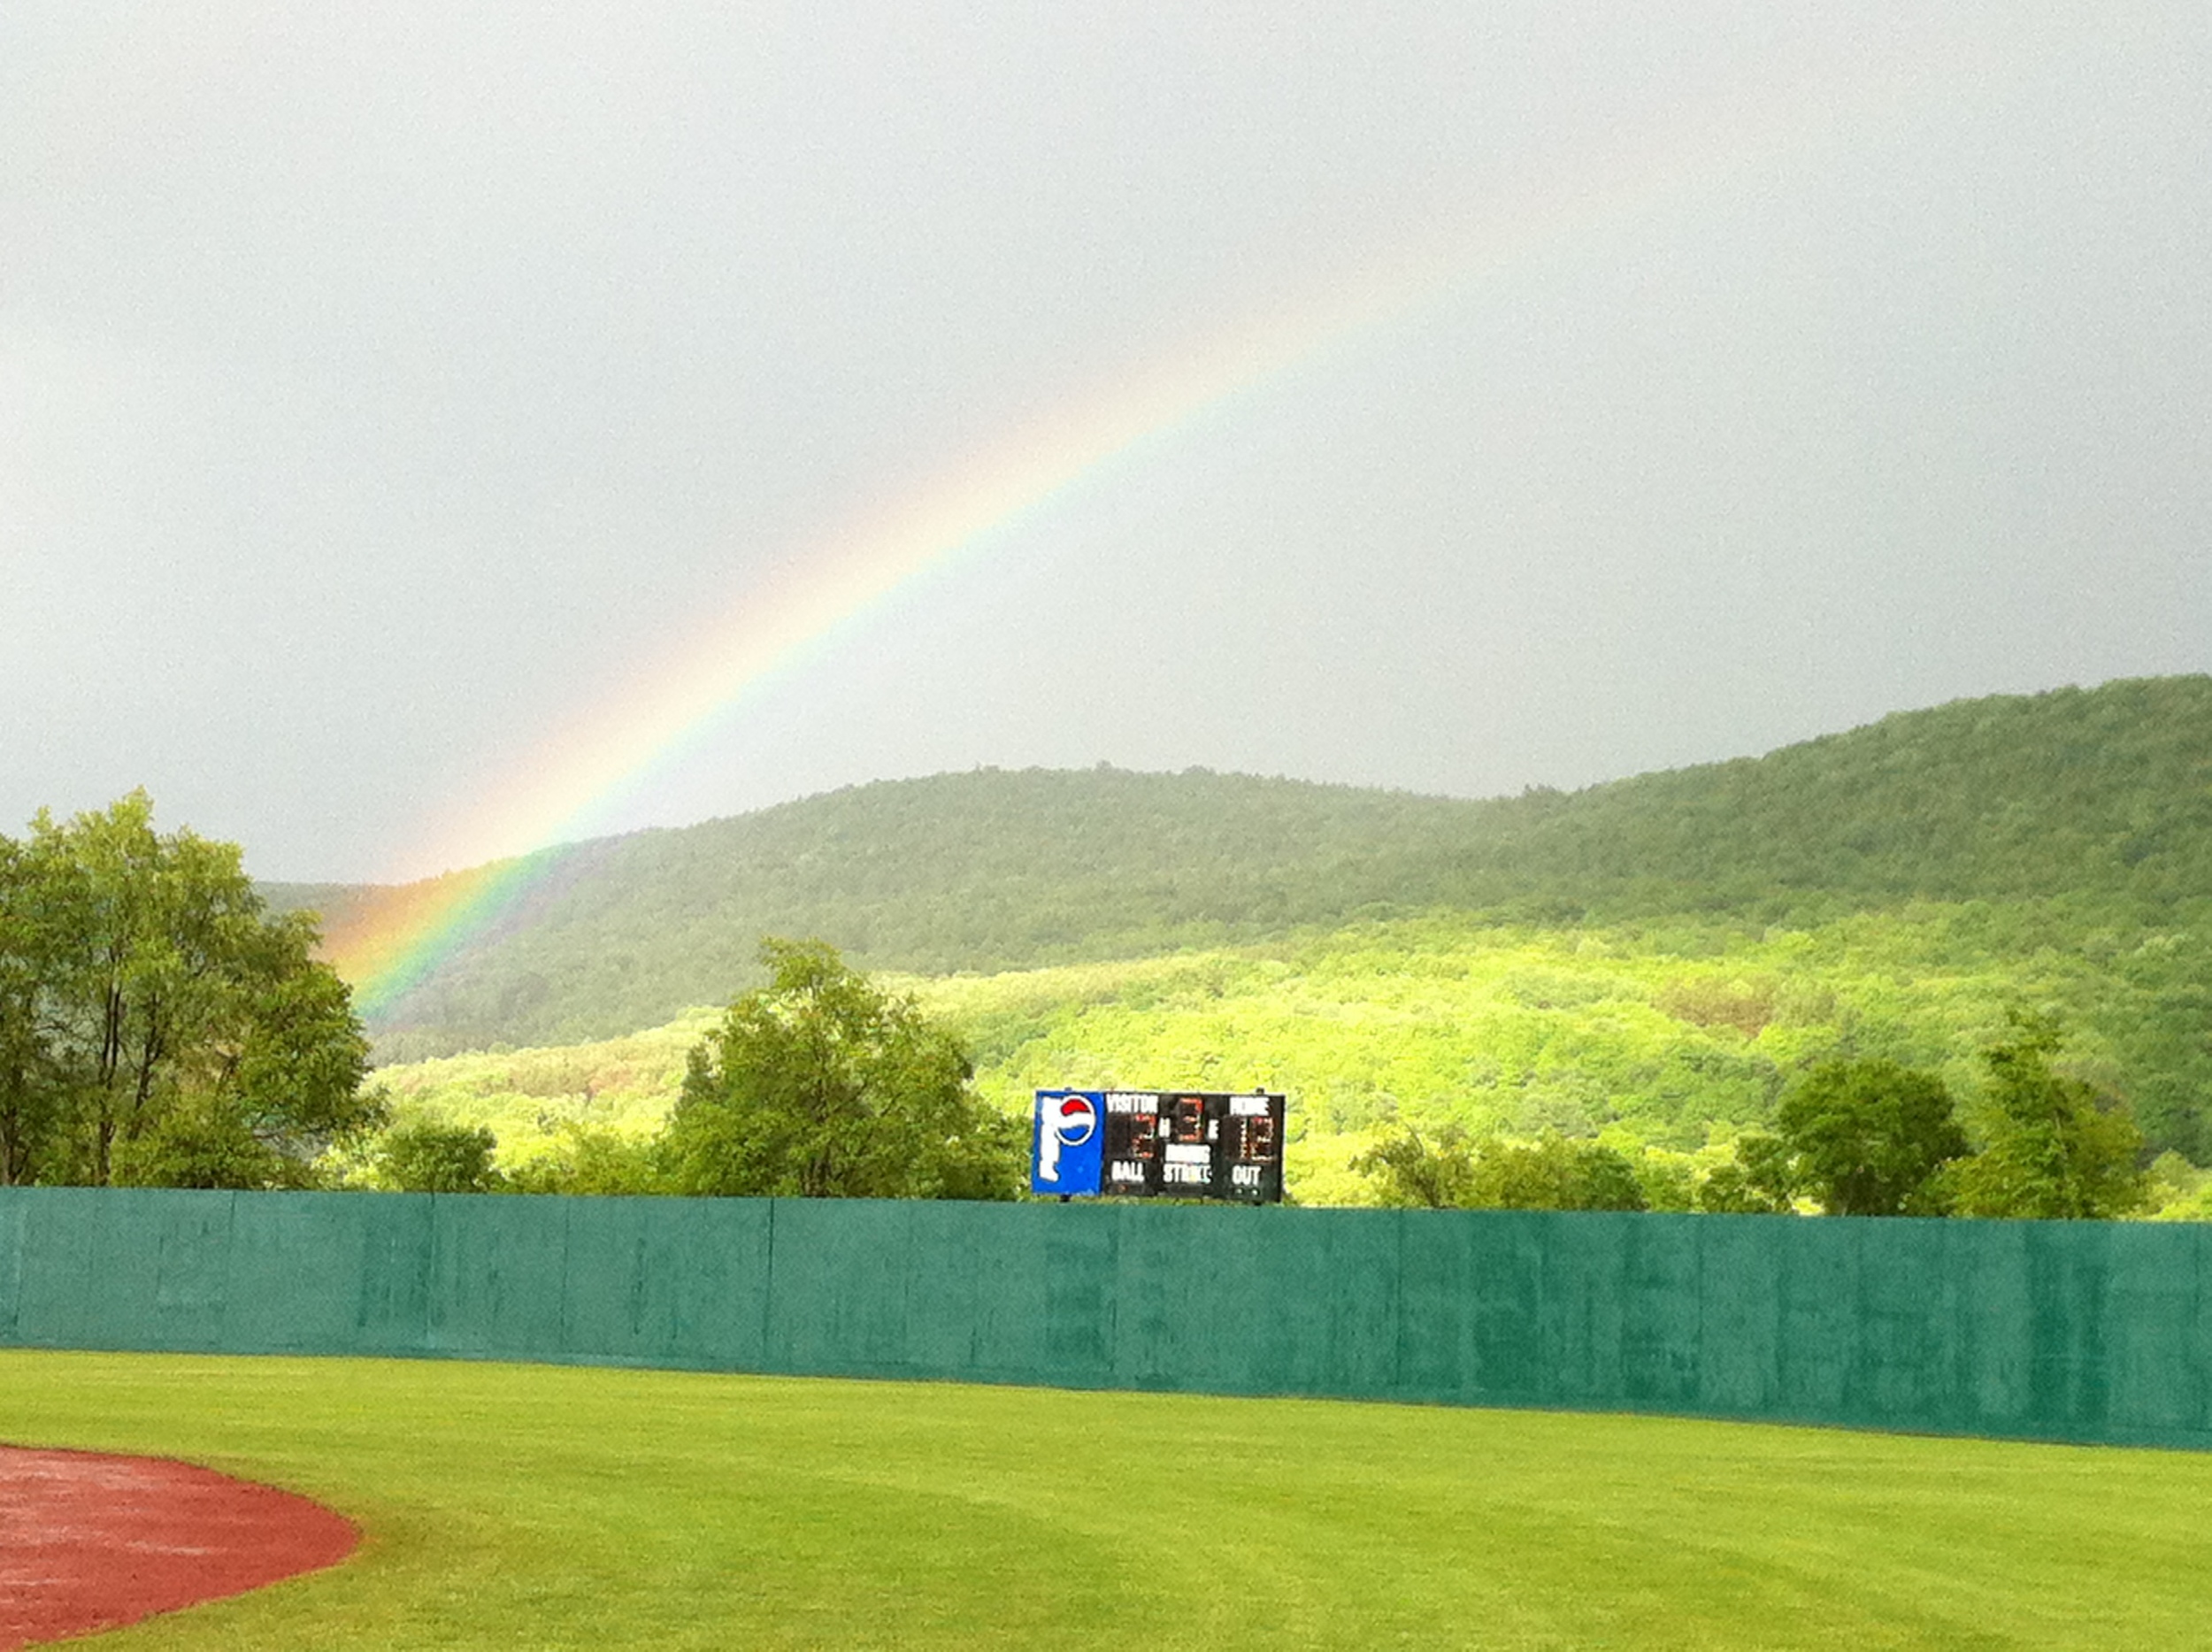
A cool afternoon rain was the only thing damper than the spirits of the 12-year-olds who shuffled off the field. With the score still lit up on the wooden scoreboard, the coaches yelled to the boys as they struggled to lift their heads so they might catch a glimpse of a rainbow as it rose from the fence in front of them.
The players of both the winning and losing teams stood there on the wet, steamy grass, frozen in place, in awe of the sight of a rainbow that mystically appeared as if painted on the sky just for them to see. For them, it was an atta boy, pat on the back, a perfect way to wrap up a hard fought double header in which the score had not quite represented the effort that the losing team had given, where the stats failed to tell the tale that brought these two teams together on the hallowed Cooperstown soil.
That’s the thing about numbers. When left to their own devices, they can feel as cold as digits on a lonely scoreboard. They say nothing of the teams who trained for months, played together game after game, relinquished their Saturdays and played nearly perfect seasons just to get to the tournament.
Numbers alone tell us nothing of context. When we have something particularly meaningful to say, images help us share it best. Dashboards and data visualizations bring to life presentations in which we can engage in two-way conversations with our audience making the story around our data more memorable, impactful and effective than any spreadsheet or table of numbers we can put in front of them.
What will your audience remember? The numbers, the final score? Share visually, and they will remember the rainbow and the sunshine that most certainly will follow.
Special thanks to Peter Bielan, my significant other, for inspiring this blog by sharing this photo that he shot during his son's baseball team pilgrimage to Cooperstown, NY this week.