

(A conversation about data)
The other day my seven year old asked, "How do you say indigo in Japanese?" I said, "Why do you want to know?" His response: "Just curious."
I love every interaction with my kids, but especially the ones where they surprise me. This particular interaction got me thinking about how tightly linked certain questions are to specific conversations.
When it comes to data, it’s no different. The conversation that surrounds a question is as important as the question itself. Both have context, a set of relevant questions and hopefully a little curiosity. You would think that because of the similarities between data and conversations, that a conversation about data would be easy. Unfortunately, not so much. Every day we see folks wrestling with how to have a conversation about their data.
Think about it. How many "data-based" conversations have you sat through that are REALLY overstuffed Power Point presentations, metric-filled reports or chart-engorged dashboards? Not a conversation, but more like an annoying advertisement. People are so afraid of "The Indigo Question", that they try to answer EVERY possible question by pommelling their audience with lots and lots of data or worse, innumerable slides.
How about trying this: communicate with data by thinking of it in the context of a conversation: Ask questions; listen to answers; don’t try to cast the conversation before it happens, but allow it to form as it takes place.
Start with understanding the questions that your audience will want to know about your data:
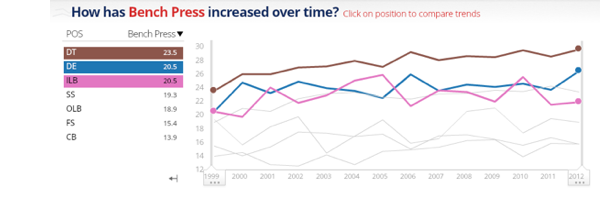
- How has number of bench presses for defensive tackles changed over time?
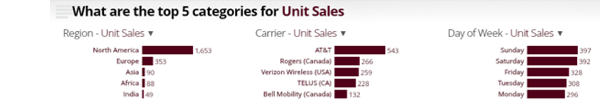
- Where are my sales coming from?
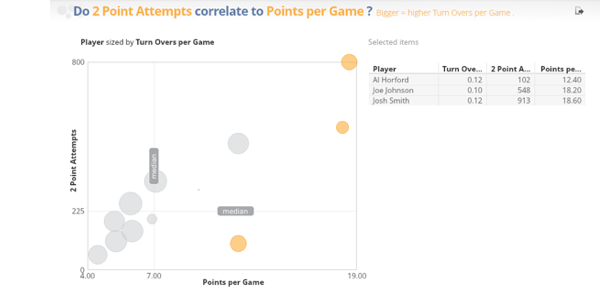
- Do field goal attempts drive total points per game?
The questions give you great insight into how you would want to show the results. For instance,
Changes over time are shown by trend lines,
comparisons can be shown with distributions,
and outliers might be revealed in a bubble chart.
In the coming months you'll hear more about the concept of a conversation with data from us. In fact, turning spreadsheets into conversations is something we think can be a transformational way to think about your data.
So, after my son and I got home from running errands that day, we went to Google translate to figure out "How do you say Indigo in Japanese?": http://translate.google.com/#auto|ja|indigo. This then led us to wonder when would a Japanese person talk about the color indigo or the Indigo plant? By afternoon both of us walked away from the conversation feeling like we had learned a bunch, cherishing the time spent and looking forward to the next conversation. After all, isn't that what we hope to achieve with all our conversations: to feel that sense of reward that makes us anxiously await the next one?
Here's to great data conversations!