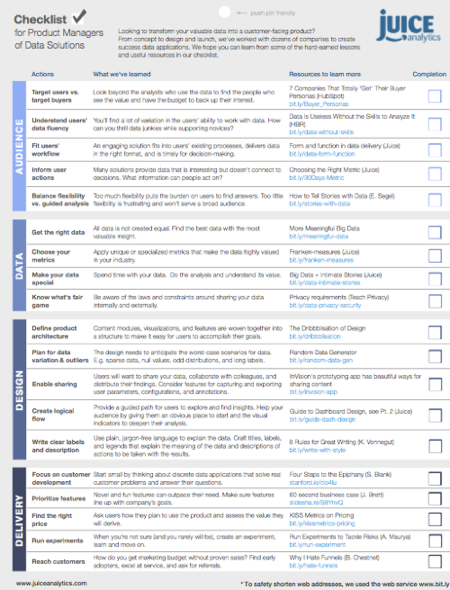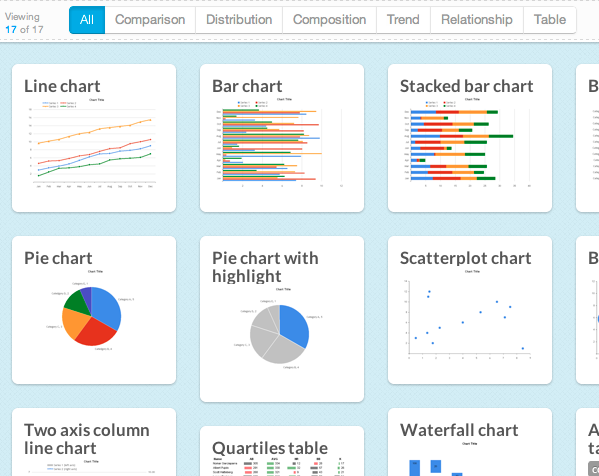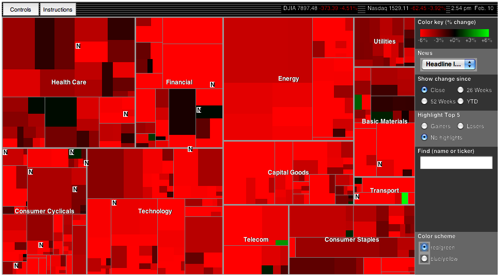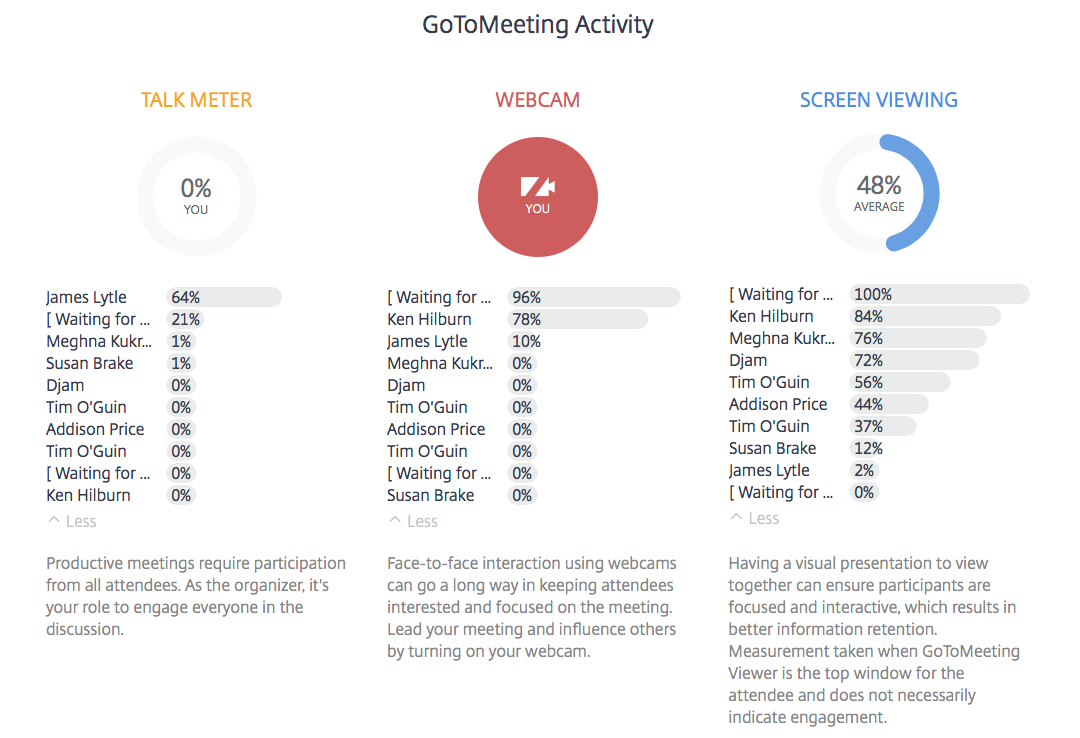
New Year's Data Resolutions

I am oftentimes on the front lines of receiving emails and calls from people interested in what Juice does, what we think, and what we have to offer. Most of the conversations I have are exploratory in nature where someone is reaching out to see if Juicebox would be a good fit for the project they are thinking about. From my experience in having conversations with companies that are working on a data project, I have noticed a few common themes.

  1. Companies are usually good at collecting data, and with modern technology it is relatively straightforward. Cloud storage is easy to obtain and becoming cheaper, but organizations struggle with the presentation of that data. (Hint: We can help with that!)
  2. Most companies have a way to access that data, but often they may not know where it is or what department or manager has access to it.
  3. There is usually one person who has the vision to bring all of it together in one place, but he or she doesn't have to support to bring the project to life.

Knowing that we can help, that person and I usually discuss what it would take to get the project off the ground. I usually hear "We have been talking about this for a long time, it is a headache, but no one will own it." I reply with, "What is stopping you from owning this and starting your data project?"

Since it is the season of New Year's resolutions, I will pose the same question to you. What is stopping you from starting your data project? Is it ownership, complexity, or maybe even leadership? Whatever it is, it is time to start. As organizations grow, complexity increases, making it more difficult. Now is the time!

There are hundreds of articles out there about data and the business value it can offer an organization. If your problem is leadership, I recommend putting together a business case as to why your organization needs to do this. The amount of time and labor to bring that data into an organized, aggregated fashion is often constrained by the amount of time available and the fact that no one has ownership. 

It usually isn't a matter of technological constraints because there is a myriad of technologies out there to gather, store, organize, disseminate, and present data. Usually it is a matter of becoming organized and the time commitment necessary to complete the project. Often there is one person who has all the relevant knowledge about where the data is and what format it is in. I recommend buying that person lunch and picking their brain about the problem. Chances are they already have some ideas about how it can be solved.

So go ahead, impress your boss, start that data project you've been putting off for months!

Have questions about starting your data project? Don't hesitate to reach out! Get in touch with us either via email at info@juiceanalytics.com or send us a message.

Battery Meters and the Goldilocks Problem

"Actionable data." It is a phrase well on its way to becoming a cliché. But clichés are often founded in truth, and it's true that the essential quest in analytics is finding data that will guide people to useful actions.

Apple’s battery meter offers a lesson in the challenges in delivering such actionable data.

The battery meter on Apple's new Macbook Pro included an indicator of the estimated battery life remaining. If you’re sitting on an airplane hoping to watch a movie or finish your blog post, time remaining is a critical measure and a source of stress. But Apple faced a problem with presenting the time remaining value. According to The Verge, “it fluctuated wildly on Apple’s newest laptops...the ability of modern processors to ramp power up and down in response to different tasks made it harder to generate specific, steady estimates.”

Marco Arment put it in simpler terms: "Apple said the percentage is accurate, but because of the dynamic ways we use the computer, the time remaining indicator couldn’t accurately keep up with what users were doing. Everything we do on the MacBook affects battery life in different ways and not having an accurate indicator is confusing.” 

It's an issue of excess precision. Users want to know a precise time-remaining answer, but the fundamental nature of the machine results in a great deal of variance. I first heard about this problem from the excellent Accidental Tech Podcast. During the discussion, John Siracusa suggests an alternative to the problem: a burn-down chart like the kind used in agile software development. Android phones offer something that looks a lot like what he describes.

Siracusa admits that a more detailed visualization of this nature probably isn’t for everyone. It may work for him (and I like it a lot), but not everyone spends their days visualizing data.

It's a classic Goldilocks problem. Too little detail (and too much precision) can be deceptive and difficult for users to understand when the number jumps around. The lonely key metric without context can be inscrutable.

Too much detail, such as in the form of a full-fledged chart, may be more information than the average user wants to know. The predominant feature of the chart, the slope of the trend, isn’t fundamentally what the casual user cares about. They want to know if the battery is going to still have life when they are getting to the exciting final scene in their movie. Data visualizations should not be engineers serving engineers (as I noted when Logi Analytics asked that Fitbit embed a self-service business intelligence dashboard in their apps).

There is a third option available -- a "porridge that's just right." The alternative is to jump straight to solving the user’s problem while still using data. The data or metric itself isn’t the point; the user’s goal is the point. A better solution for Apple might look like this:

When it comes down to it, the problems Apple faces with its battery life estimates aren't so different from the problems we all face in delivering actionable data. The solution can be boiled down to a simple formula: Use the data to solve the problem. Keep the user informed. Give them a smart choice. 

And always have your charger handy, just in case.

Thirsty for more? Check out these related blog posts:

Leveraging Data to Generate Value

Lydia Jones is a business and legal data monetization strategist and adjunct professor of law at Vanderbilt Law School and Boston University School of Law. Lydia and her consultancy firm InSage LLC are the 2017 producers of The Data Monetization Workshop, an annual event that brings together industry leaders and data monetization innovators to discuss data-centric opportunities, address perceived challenges, and transform the C-Suite conversation.  Learn more and register for the Workshop here.

You have defined data monetization as "leveraging data to generate value." I'd like to explore more about what you've learned as you talk to companies looking to get value from their data.

The role of Chief Analytics Officer or Chief Data Officer has become increasingly common as organizations try to focus their efforts on data monetization. From your experience, what kinds of companies have pursued this strategy and established this data leadership role? That is, what conditions need to be in place for a company to pursue this type of innovation?
I look at the data-centric ecosystems that exist in the private sector as broadly as possible, and that includes looking at how private companies are working with local governments to leverage data and to generate value for public goals as well. So to start, companies willing to learn from,  or collaborate with, entities outside of their core industry is one condition. Another condition includes a willingness to view data as a business opportunity rather than as just a cost item in the CTO’s budget. Once data and data-centric revenue are seen as crucial parts of business operations, focusing on data opportunities analysis is key, and having the right skill set for that task is even more so. The shift from data as an anchor to data as an opportunity typically moves a company to consider whether, and when, to create a Chief Analytics Officer or Chief Data Officer position to address opportunities, to leverage data, and to generate value for the company, its partners, and its customers.

What kinds of distractions have you seen that may give a company pause in either creating a data leadership role or pursuing innovative data-centric monetization thinking?
A change in perspective about opportunities that may arise from data collection, data sharing, and data analytics, or from the creation of a new position such as a Chief Analytics Officer of Chief Data Officer, is not enough to fully leverage data monetization initiatives. A company must also change the internal conversation about perceived risks concerning data value and data monetization. Many companies misperceive risks, such as privacy risks, when valuing data and when assessing whether to engage in innovative data monetization initiatives. Companies that have opportunities to leverage data must resist being swayed by misperceptions about privacy. For example, many companies have a blanket rule against monetizing personally identifiable information. While this may be the prudent choice under some circumstances, many companies adopt this position as an automatic universal rule because of a perceived, but oftentimes unfounded, risk concerning privacy. For example, data monetization opportunities arising from the collection and sharing of personally identifiable wellness data are routinely rejected under the perception that privacy rules – such as those found in the HIPAA Privacy Rule applicable to personally identifiable health data – prevent the monetization of wellness data when in fact those rules usually don’t.

This kind of thinking based on misperceived privacy risks undermines innovation. One need only look at the popularity of mobile applications through which consumers pay to give real-time generated personal data –  from retail purchases to geolocation data to biometric data – to companies in exchange for data analytics and insights. When consumers are demanding highly personalized products and experiences, it becomes a necessity for a company to consider, or to reconsider, how to best generate value from personal data. Yet for those companies that misperceive the risks associated with data monetization, these opportunities are left to competitors.

Can you share a few examples of the kinds of entities that you think are doing innovative things with data and data monetization?
Innovative data-centered projects span across the corporate sector, the nonprofit sector, and the local government sector.  Big Data Quality recently published Big Data 50 -- Companies Driving Innovation
, which is worth checking out here. And in the nonprofit sector, data scientists are moving into the role of the chief data officer. DoSomething.org is an example of a nonprofit that hired a data analyst for the dual role of data scientist and chief data officer nearly three years ago. Finally, in the local government sector, we are seeing innovative leaders creating the chief data officer position to support data-driven strategies aiming to serve public goals such as increasing efficiency in public education, fire safety, and public health. In fact, Nashville just joined the short list of innovative cities – including Boston, Chicago, New York and Los Angeles – when it hired its first Chief Data Officer, Dr. Robyn Mace, in 2016.

Looking forward, 2017 holds significant promise for companies willing to engage in proactive data monetization discussions that redefine data monetization as “leveraging data to generate value,” that thoughtfully consider and assess perceived privacy risks, and that consider data as a corporate asset to expand business opportunity and competitive advantage.


Book Review: "Bringing Numbers to Life"

"The effort was none other than to do the hard work of bridging numbers and people, and building that work into products that entice, even seduce, skeptical users to invest in an unfamiliar activity."

In his new book "Bringing Numbers to Life",  John Armitage sets out to create a design framework for analytical apps. It is a worthy subject and one that is close to home for our Juice team.

Mr. Armitage’s book has been published online and free-of-charge by the Interaction Design Foundation. The Foundation’s founder, Mads Soegaard, shared their vision: "We offer complete, unrestricted and free access to our chapters/books/textbooks in online versions. Everything we do is a labour of love and not a business model. We walk the talk of altruism.” The IDF hosts a wealth of free materials and textbooks, with contributions from top academics and professionals.

The book is a worthy subject delivered by a worthy organization. I was happy to share my thoughts.

"Bringing Numbers to Life" describes the how, what, and why of a “design-led innovation in visual analytics. The author is a lead designer at SAP (update: John Armitage is now head of UX design for Host Analytics), the software behemoth and vendor for such business intelligence products as BusinessObjects, Lumira, Roambi, and Crystal Reports. He was charged with creating a unified design model across these products to make them more effective in the communication of data. In his words:

“The result of this effort was a number of prototype projects that led to LAVA, a design language for visual analytic environments intended for broad application across the SAP product suite. The key driver behind LAVA was simplicity and low cost, which translated into some fundamental innovations that, with the backing of a large company like SAP, stand to improve the clarity and reach of visual analytic consumption in the workplace and beyond."

The analyst’s office is filled with books by Edward Tufte, Stephen Few, and Alberto Cairo providing guidance on how to visualize data. But what about the designer or developer of analytical solutions? Their challenge is in many ways more complex.

Armitage makes an important distinction between “Artisanal" and “Production" solutions. It is one thing to craft a one-off visualization solution for a specific purpose. In these cases, the author knows the data, the audience, and the specific message they want to convey. His challenge is to develop a system that can repeatedly deliver high quality data visualization and analytical tools. It is the difference between the carpenter who can craft a single table and the engineer who can create a factory that delivers a thousand tables. The requirements, skills, and frameworks are very different.

Armitage has researched this topic thoroughly. Over many years, he worked with internal SAP teams and consultants to define and refine his LAVA (Lightweight Applied Visual Analytics) framework. His framework describes important pieces for any analytical solution, and how these pieces should fit together. While he defines a specific nomenclature, the elements are universal building blocks. A few examples:

  • Charts can exist at different levels of detail and fidelity. When we want to represent a concept, it may appear as a single number or sparkling (“micro chart”) or a fully-labeled trend chart (“chart”) or as part of a multi-component, interactive visualization (“meta chart”).
  • Analytical tools need a hierarchy of components that allow a user to consider a broad concept, drill into more detailed topics, and explore specific data.
  • Modern analytical applications need to offer much more than the visualization of data. Features for sharing, collecting insights, and personalization are necessary to deliver a complete analytical tool.
  • The traditional single-page dashboard design is antiquated. "Scrolling effectively increases the virtual size of your display outside the borders of your window or device, and is a basic convention for digital content consumption that has been ignored in traditional dashboard design."

Armitage is also a critic of the increasingly complex and bloated analytical solutions — something I hear more and more from companies frustrated with visual analytics tools like Tableau.

"Currently, however, most visual analytic solutions reflect previous efforts to serve large high-paying enterprise customers, and are thus bloated with features designed for highly trained – and high-paying – specialists. As Clayton Christenson’s principle, and associated book titled The Innovator’s Dilemma tells us, companies in such high-margin businesses are beholden to serving their large customers, and thus leave the low-end of the business exposed to inroads by newcomers to the market. Visual analytic market leaders are facing such a dilemma today."

Despite my fondness for the topic and appreciation of Armitage’s evident research, the book has issues that I found hard to overlook.

Armitage indulges in lengthy tangents, personal biography, and an obsession with the specifics of the SAP landscape and politics — providing us with sentences like this:

“I even produced a farcical off-site video on the theme of multinational collaboration, and a comedy routine – based on the famous “Who’s on First?” from Abbot and Costello – to poke fun at working in multinational teams. I performed the latter live with Jay Xiong at our 2012 office holiday party in Shanghai."

He also appears to be fighting a public battle with the leadership of SAP to adopt his LAVA model in the pages of his book:

"Although LAVA, in particular the Lattice, pointed to similar effects for quantitative data, it was difficult for some people who were particularly close to BI to acknowledge its potential. The definitive objection from this faction was that LAVA “does not match Our metaphor”, which was of course precisely the point. LAVA is a new metaphor, and one that’s necessary for achieving SAP’s product aspirations."

I have a deeper concern with some of the recommendations for visual solutions. One of the features concepts is a "Lattice chart”. I found the example provided to be confusing and complex. Designing visualizations is an exercise in finding simplicity and accessibility for your audience. The image below is crammed full of information, but lacks the legend or space for a typical user to know what it all means.

Perhaps my biggest concern is with Armitage’s long-term vision. He expresses a desire to create an analytics world where human intervention isn’t necessary to communicate data effectively.

With this scalable framework in place, we can start to dream of efficiencies on a large scale, with entire Board Sets generated automatically from adequately-provisioned data warehouses. Filters, Panels, and Lattices can be determined with a rules engine automatically from combinations of Measures and Dimensions. Galleries can be populated by algorithm-generated charts derived from the most relevant Lattice Layers. Points can be created from data set indexing and data mining, and populated with major category representations and outliers. Multiple data sets can be organized into groups and presented as Board Sets, or one giant data set can be subdivided into Boards according to individual or sets of Measures or Dimensions, with these Boards further subdivided into Categories and Lattice stacks according to the depth and complexity of the data. These efficiencies will allow more people to use data to make decisions, and require fewer people to support them.

In my experience, data communication needs to start with an intimate knowledge of the business context, an appreciation for your audience, and an understanding of what it takes to make them more effective in their jobs. These aren’t things that can be scraped from a database.

Philosophical issues aside, this is a book about Armitage’s journey in trying to change how an organization delivers analytics, his process and research, and the quite-useful framework that came from his journey. As someone who has tackled the same design challenges in creating a new kind of tool for visualizing data, I appreciated being able to get an up-close view of how another professional wrestled with common challenges.

In describing his conclusions, John Armitage notes, "During LAVA’s development, I found myself surprised that nobody had before arrived at our fairly simple and basic conclusions."

Don’t worry, John, you’re not alone.

Gift Ideas for Data and Visualization Lovers: 2016 Edition

The trees have lost their beautiful fall foliage, the days grow shorter and icier, and our pants have gotten tighter from all of the pie that we ate at Thanksgiving. All of this can mean only one thing: it’s officially the holiday season! It may be the most wonderful time of the year, but it can also be the most stressful. There are always those people who are just impossible to shop for, and data viz lovers are no exception. To help with the dilemma, we’ve compiled a collection of what we think data and visualization fans would most like to receive. Grab a mug of steaming hot chocolate and get ready to shop!

Books

I know, I know. Books are on every gift guide, but hear me out. 2016 saw the release of some incredible publications on topics such as daily data visualizations, how to pick the right chart for your data, and becoming a more persuasive speaker, just to name a few. These books are not just informative and interesting, they have also most likely been in your data viz enthusiast’s Amazon cart for some time. So while books may not be the flashiest gift, they're something that the people on your list truly want. Here are some of our favorites:

Better Presentations: A Guide for Scholars, Researchers, and Wonks by Jonathan Schwabish

Data at Work: Best practices for creating effective charts and information graphics in Microsoft Excel by Jorge Camões

Data Visualisation: A Handbook for Data-Driven Design by Andy Kirk

Dear Data by Giorgia Lupi and Stefanie Posavec

Effective Data Visualization: The Right Chart for the Right Data by Stephanie D.H. Evergreen

Good Charts: The HBR Guide to Making Smarter, More Persuasive Data Visualizations by Scott Berinato

Illuminate: Ignite Change through Speeches, Stories, Ceremonies, and Symbols by Nancy Duarte

The Truthful Art by Alberto Cairo

Data Fluency: Empowering Your Organization with Effective Communication by Zach and Chris Gemignani

Prints & Posters

What could be a better gift for someone that loves data and visualization than an actual data visualization? And with so many options, you can easily match it to other interests and hobbies. Political junkies can enjoy visual histories of the Republican and Democratic parties available over at Timeplots. Your friend that happy-cried when the Cubs won the World Series can remember it forever with Chartball’s visualization of the 2016 season. And for everything else, there’s Popchart Lab. They have an incredible amount of visualizations ranging from a charted cheese wheel on an actual cheese platter, to all the varieties of beer, to a chart about nothing.

Data Products

Wearable technology that provides personalized data and information? Sign us up! Fitbit recently released the Charge 2, which not only tracks daily activity and sleep but also measures how your cardio health compares to people similar to you. An option for someone who may not want an attention-drawing wearable on their wrist is the jewelry from Ringly. Ringly offers rings and bracelets that track similar activities as the Fitbit (such as calories burned, steps, and floors climbed), but also syncs with your phone and sends app notifications. And who says data products are only for people? Let Fido in on the action and check out Nuzzle. Though currently only available for pre-order, Nuzzle is a smart pet collar that ensures that if your pet ever gets lost or sick, you’ll know. It uses GPS and temperature monitoring so that you can check in on your pets from your phone and see how they’re doing throughout the day.

Cards

There are two very useful card sets that debuted in 2016 that would both make great gifts. The first is the Data Visualization Chart Chooser Cards, a Kickstarter that quickly gained momentum not long ago. Similar to Juice’s own Chart Chooser, the cards help the user to select which chart is best for displaying and communicating specific data. The other card set that would make a great gift is the pretty and practical set of Graphic Continuum flash cards from Severino and Jonathan Schwabish. 

Datasaurus

A few months back, Alberto Cairo demonstrated the importance of visualizing data before putting your blind trust in summary statistics with the Datasaurus. The tweet quickly gained popularity, and thanks to the power of the Internet you can now get the Datasaurus on t-shirts, mugs, pillows, and phone cases. Fashion meets function meets data viz, and something that the data nerd in your life will think is a hoot.

Subscriptions & Donations

Perhaps one of the best gifts you can give the data and visualization lover in your life is a subscription to a news source that routinely produces impeccable graphics and charts. Outlets such as the Washington Post, The New York Times, and The Guardian are all great options for someone looking for timely data visualizations. If the person already has a subscription to one (or all) of these, consider giving the gift that keeps on giving and make a donation in the recipient’s name to ProPublica.

Did we miss your favorite data-themed gift to give? Let us know! Send us a message at info@juiceanalytics.com. Most importantly, have a happy holiday season!

Data Product Resources

The concept and creation of data products isn’t a new phenomenon, but it is something that has started to gain an increasing amount of attention recently. A rising topic within the data industry, more and more organizations across the world are beginning to question what data products are and how to get started building them. There isn’t a ton of literature on the subject, but there are some emerging thought leaders who have been vocal on the subject and who Juice often turns to when looking for inspiration and guidance. If you’re looking for more information on data products, check out some of the people and organizations below.

DJ Patil

Ok, so this one you’re probably already familiar with, but we say it still warrants a mention. If the data world had rockstars, DJ Patil would be right up there with Bono. He’s the U.S. Chief Data Scientist, and, among other accomplishments, created the definition of data products that was part of the inspiration for Juice CEO Zach Gemignani’s presentation at this year’s Nashville Analytics Summit, Data is the Bacon of Business. If you’re looking for information on data products, check out “Everything We Wish We’d Known About Building Data Products”, an article that covers a presentation he gave at First Round’s CTO Summit on the peaks and pitfalls of building data products (or you can follow him on Twitter).

Kevin Smith/Next Wave BI

Every time Kevin Smith of Next Wave BI posts a new blog post on data products, we get a warm, happy feeling inside. Kevin knows his stuff -- he’s been building data products for over a decade, and in that time has gained invaluable insight into what works and what doesn’t. Through his blog and social media accounts, he shares his unique perspective into data products, dashboards, analytics, and so much more. We recommend his post “The Five Biggest Mistakes in Building a Data Product” in particular; it’s a great piece on how the non-technical aspects of data products are likely to trip you up, and how to circumvent them.

Blue Hill Research

A research and advisory firm that focuses on enterprise technology, Blue Hill has become one of our go-to places for interesting articles on data products. They also cover subjects such as dashboards, big data, and analytics, and mix a unique view with a fresh voice. We’re partial to the post “Data’s New Role in the Enterprise: Build Data Products. Make Money”, but we admit we may be a bit biased. Check out their blog for more content on data products and data monetization.

Juice Analytics

It was the great Leslie Knope who once said, “I am big enough to admit that I am often inspired by myself.” While we may not go so far as to say we inspire ourselves, if you’re looking for more information on data products take a look at our entire collection of blog posts on the subject (and check back often, as we are constantly adding to it!).

Of course, these are just a few starting places to learn more about data products. If we missed your favorite data product resource, let us know at info@juiceanalytics.com or send us a message.

Three Keys to Data Monetization Success

“You may have heard in your organization that [data monetization] should be easy -- repackage data, find customers, sell product, achieve success -- mission accomplished,” writes Lydia Jones, InSage founder, and Karl Urich, president of DataFoxtrot, in a recent article on Tech Target. But while the process of monetizing your data may seem straight-forward, it's actually much more complicated and nuanced than it first appears and it requires a plan. 

Like with most new projects, the hardest part for an organization looking to monetize its data is getting started. With so much involved in the process, it can be overwhelming to know what to take into consideration when creating a data monetization plan. Jones and Urich shared three things organizations should evaluate as they begin the process of data monetization and we think they gave some great advice.

Evaluate business opportunities

One of the first places to start to build your strategy is to have a solid understanding of the types of businesses and industries that can benefit from your data. Sounds simple, right? Jones and Urich go on to explain that it takes more than just looking around at the organizations in a similar industry - you should also take into consideration those that aren’t as obvious.

Jones and Urich give tips on how to identify those industries, and we’d add that one of the easiest ways to identify the kinds of organizations that can benefit from your data is to ask this question: What pain point can my data solve? Once you can answer that, it makes it much easier to identify potential customers. It also begins to give you direction. Knowing the problem you want to solve for customers is a key starting point for building a successful product. 

Evaluate data regulations

There’s nothing worse than investing a substantial amount of money, time, and energy into your data monetization plans, only to find that they’re not viable due to data regulations. “In the United States, data privacy is regulated on a sector by sector basis,” Jones and Urich advise. You should be familiar with the regulations in all potential customers’ industries.

Evaluate cost/benefit

Evaluating the cost and benefit of monetizing your data starts with two questions: “What will it cost to build and maintain over time?" and "What price will people accept?” This may take some time to fully understand, but it's an important question.

Keep in mind as you consider what price and pricing models you should adopt, that it’s not just about the data being sold, but about the insights, metrics, etc., that are a part of your data. Don’t simply position your information as raw data, but as but rather as a solution that solves a problem.

These three key points are an excellent starting place for your journey to monetize data. If you still have questions about getting started or about data monetization and data products in general, check out some of our blog posts on the subject or send us a message.

A Blueprint to Insight

It's often easy for me to take for granted the insights I regularly receive from data. Whether that be from tracking a run with my Fitbit, looking at likes and views on social media, or using Google Maps to help me avoid traffic. Working for a company that has the word "Analytics” in its name means that I spend a lot of time in data, and working for a company as creative as Juice means I get the opportunity to truly enjoy navigating data as a visual experience.

I have mentioned our new product Blueprint a couple of times already, but I wanted to share some of the insights we've been finding in hospital and health system data and how that data affects internal decisions. According to a study from Becker’s Hospital Review, a hospital's workforce accounts for 54.2% of a hospital's overall operating costs. These people are a huge investment, and so the hospital needs to make sure that it's hiring and retaining the best people. It can be quite the undertaking to make sure that the Emergency Department has staff with enough experience to adequately do the job, or that hospital supervisors are retaining top talent.

As we have been digging into some of these different facilities' workforce data, we have started to come across varying insights that have turned out to be valuable to hospital leadership. For instance, Blueprint can show a Chief Operating Officer where she has the opportunity to consolidate. There are often multiple people who are spread out across a facility which could be consolidated into one or two units, reducing overhead. For a larger hospital system with multiple facilities, Blueprint can allow a leader to compare facilities across their enterprise. With this information they are able to compare by important metrics and ratios like staff-to-supervisor ratio, or staff to provider ratio across all their facilities.

Turnover, often a primary concern for HR, is another hot spot with which Blueprint helps provide insight. Recently, Blueprint was able to help a pilot customer that manages over 40 senior living communities locate the departments and managers with the most turnover. As we have continued to discuss Blueprint with HR leaders, they have expressed the need to be able to tie turnover to root causes like compensation or employee engagement. Since Blueprint is designed to take a large number of staff and find further subsets, it can act as a funnel to get you to the group of people you are looking to take action on. I was talking to an HR Director at a hospital yesterday who was saying that she has a hard time tracking the number of interns they have at any given time and what departments they are in. Using Blueprint, we were able to find that information within a matter of a couple of clicks.

By taking the HRIS data of a hospital and health system and categorizing it in a meaningful way, we feel as if we have stumbled onto something truly valuable. The finish line being helping hospitals and health systems build a successful Blueprint for their organization.

Want to know more about Blueprint and how it could help your organization? Drop us an email. We'd love to hear from you.


Driving Healthcare Data Culture Forward

Last week, Juice Analytics participated in the Health 2.0 Atlanta panel, a co-hosted event by the Data Science and BI Society of Atlanta and Health 2.0 Atlanta. The focus was on analytics and healthcare and it was a great event. There was so much interest, they had to move the event to a larger venue! That tells me two things - (1) people want to get more out of their data and (2) Healthcare is behind and they really want to catch up. Two of my favorite “tweetables” of the night, said by Jason Williams, VP of Analytics and Strategy at McKesson, backed up those assumptions.

Getting more out of your data

The first “tweetable”  was something we see at Juice all the time: “Nobody wants analytics, people want answers.” This relates back to people wanting more out of their data. Right now many people simply have data - and that’s it. But people want more than just a bunch of charts and numbers on a screen, they want insight. They want to be told where the problem is and given insight into how to fix it. If you’re simply delivering data either in a spreadsheet or just a series of charts, you’ve missed the mark. And for the record, this problem isn’t specific to healthcare. It’s all over.

Catching up in Healthcare and the path forward

My other favorite “tweetable”, originally said by W. Edwards Deming, was “In God we trust; all others bring data.” To get buy-in on a problem and solution, you need the data to support your position. The problem is that not everyone is ready to embrace data. As the quote alludes to, it’s all fine and well to think or believe you know the answer, but data helps you actually know the answer. Sure there can be a human element involved, but being informed with data to back up decisions is useful and important. In order to move data in healthcare forward, there needs to be a culture around data. It needs to be ingrained in an organization as useful and be included in everyday conversation.  

Embracing a data culture in healthcare will become even more important as we move into the future of what healthcare could look like. Much like Google Maps on your phone adjusts your course based on a wrong turn or an accident on the highway, it was said that healthcare will begin to use data in much the same way. Healthcare data should and will move in the direction of being event driven and using data to adjust as things are happening, rather than being reactionary. I don’t know about you, but that sounds exciting and full of promise! But to get there, you first need a good data culture.

The event was not only a great success, it was insightful - which is what we love! It would seem that to begin to move your healthcare organization forward, there are two things to focus on. One would be providing insight, not just data. The other is to promote a culture of data that is widely adopted within the organization. Without that, having insight won’t matter since nobody will want to use it.

To learn more about creating a data culture in your organization, check out Data Fluency: Empowering Your Organization with Effective Data Communication, written by Juice Analytics founders Zach and Chris Gemignani.

To learn more about how we help our healthcare clients provide data insights and succeed, check out our case studies or get in touch.


How to Build Better Data Products, Part 2: Development

This is the second in a multi-part series on launching successful data products. At Juice, we’ve helped our clients launch dozens of data products that generate new revenue streams, differentiate their solutions in the market, and build stronger customer relationships. Along the way, we’ve learned a lot about what works and doesn’t. In this series I’ll take you through what you need to know to design, build, launch, sell, and support a data product. Read Part 1 of the series here.

If “Data is the Bacon of Business” (TM), then customer reporting is the Wendy’s Baconator. Sure it contains bacon, but nobody is particularly happy with themselves after eating it.

In a recent blog post, we described the differences between customer reporting and data products. Those differences result in some very different functionality requirements. In particular, data products require more C.L.I.C. D.R.A.G.

  • Context — Benchmarks, comparisons, trends, and/or goals that encourage decision making.

  • Learn — Help and support features to train users to get value from the information.

  • Integration — Connections with other software systems to integrate with data and enable operational actions.

  • Collaboration — The ability to save insights and communicate them with other people. Decisions aren’t made on an island.

  • Documentation — Because data products live on and touch many people within your organization.

  • Reporting — To track usage of the data product.

  • Administration — Features to manage users and control permissions.

  • Guidance — To point users to the most effective ways to explore and understand the data.

This collection of capabilities gives some indication of the gap between your standard customer-facing reporting and a complete data product. To accomplish all of these, you’ll need more than a talented BI report writer and access to your database. In our experience, the recipe for building a successful data product is dependent on a number of specialized roles.

Product Manager

The Product Manager sets the vision of the product. He gathers the necessary resources to make the team successful, and builds organizational support for the product.


UI/UX Designer

The UI/UX Designer understands the user’s workflow and how to best guide the user to decisions. She crafts the interface and interactions to make the data intuitive. She's also in charge of design application styling and all visual elements.

Business Analyst

The Business Analyst translates application design into technical and data requirements. She's responsible for documenting business logic as product decisions are made.


Front-end Application Developer

The Front-end Application Developer's role is all about building interface elements, interactions, and data visualizations.

Back-end Application Developer

Data Guru

The Back-end Application Developer does everything the Front-end Developer does, only backwards. Just kidding! But he does build the application server environment an define data queries to support UI interactions.

Data Scientist

In addition to having the coolest title, he provides access to raw data sources. He understands and communicates the meaning of data fields and calculations to the development team.

Technical Architect

The Data Scientist defines the questions that will help end-users make better decisions. She enhances data through predictive modeling and other advanced data analytics techniques.

Quality Assurance Engineer

He's the general technical architecture of the product, responsible for figuring out how the application connects to data sources and integrates into other systems.

The Quality Assurance Engineer evaluates whether the data product meets the need and requirements set out in the design process. He also tests data accuracy and product functionality.

It's a big load. That’s why you might want some help before going at it alone. At Juice, we've built a technology solution and an expert team that fills out many of these requirements. We have a set of visualization components and interactive features that ensures your application is a first-class user experience. Combined with our experienced design and implementation teams, we’ve got many of the resources covered. Our clients bring the product vision; we make it happen.

Our goal at Juice is to streamline the data product launch process so you can launch innovative data products in weeks, not months. Want to know more? Let us give you a demo.