
Some recent work in online training reminded me of this concept that we discussed almost eight years ago. It is an analysis-visualization approach that I still believe is underutilized.
The Value of Film Study
In business as in sports, behind-the-scenes analysis is the foundation for on-the-field success. That is the promise of business intelligence – and the reality of film study in the National Football League (NFL).
NFL coaches and players spend hours analyzing film to identify the strengths and weaknesses of their opponents. Coaches scour video for opponents’ tendencies and use this knowledge to build their game plan. For players, film study gives them understanding that lets instinct take over on the field. Consider some of the techniques involved:
- Get granular: Examine raw data such as where players are positioned, who gets the ball from different formations, what plays are called at different field positions, and even the technique used by individual players.
- Use your eyes: Rely on your brain’s ability to recognize patterns; look for unusual actions and note when they occur.
- Group common patterns: Record these patterns by player, by formation, by down and distance. These patterns are the building blocks of analysis, letting the coach ask questions like: Does a formation give clues about the play being called?
- Build strategy from the bottom up: Finally, use this deep understanding of the opposing team’s tendencies as the foundation for the game plan.
This type of approach is different from most business analytics. Imagine if an NFL team depended solely on statistics and reporting tools to build their game plan. Football teams wouldn’t see much success if they only looked at average yards per carry and which players on the opposing team touched the ball most.
Slicing and dicing statistics doesn’t help much when deciding on a game plan. Business intelligence tools can explain the size of the problem (how good is the opponent?) and trends (what are their preferred offensive weapons?). These same tools do not, however, provide real perspective on customer behaviors or insights that give your organization data-driven direction.
Customer Flashcards: Making Pictures
How do we bring the value of film study to business intelligence? The solution we've developed is inspired in equal parts by Edward Tufte and Malcolm Gladwell.
Tufte is an expert at information presentation and design. One approach he has popularized is small multiples: placing sets of identically structured graphics on a single view to show different instances of the same data, as illustrated below.

This example of small multiples compares the annual deaths by assault per capita across countries. The size of this problem in the United States is evident.
Small multiples enhance comparison and reveal the scope of variation. By using the same dimensions and scale, small multiples also relieve the viewer from relearning the data graphic’s structure.
We extend this technique to understand customer behaviors by combining usage data, marketing touchpoints, service calls, and other interactions to create a simple graphic that shows many aspects of a single customer’s behavior. Here are a few examples from our work:
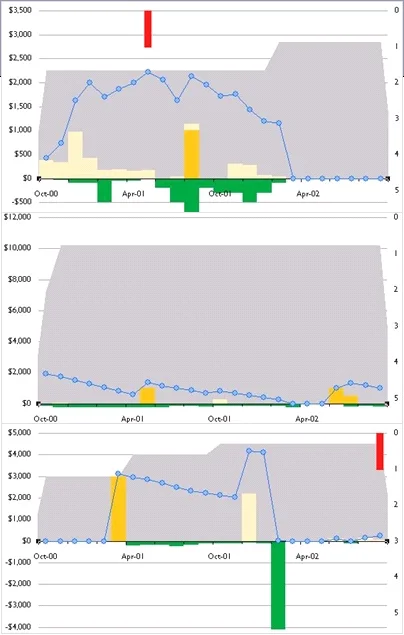
Visual representation of credit card accounts. The blue line is the account balance; yellows are purchases and cash advances; green is payments; the grey background is credit line; red bars show delinquency. Notice full vs. gradual pay-down of account, building credit lines, transaction inactivity.

Four examples of individual students progressing through an online curriculum. Vertical axis is the lessons in order; horizontal axis is time. The grey line shows the “optimal” progression over time. Notice steady vs. erratic progress, breaks in progress, and out of order lessons.
These pictures are intriguing, but are they useful? In his book Blink, Malcolm Gladwell introduces the idea of thin slicing: "the act of relegating the decision-making process to the adaptive unconscious by focusing on a small set of pertinent key variables, as opposed to consciously considering the situations as wholes over much longer periods of time." He explains how people become experts at quickly evaluating the relevant data and arrive at a rapid understanding of a situation.
We want to give businesspeople a sense of their customers in a blink of an eye. To do so, customer flashcards need to be intuitive and easy to learn. Success is the ability to show these pictures to anyone in the organization – from senior executives to front-line customer service reps – and have them grasp what they are seeing with just a few minutes of explanation.
Finding the Patterns
Customer flashcards, thousands of them, are raw material for analysis. They are the game tapes of business film study. Like NFL coaches, the next step is to put your visual pattern recognition abilities to work. As Stephen Few put it recently:
"When used effectively, visualization extends the reach of traditional business intelligence to new realms of understanding – not as one means among many, but often as the only effective means available. I believe that information visualization will enable the next significant leap in BI’s evolution."
Think of the game Memory you used to play as a child, turning over one game card after another looking for matching pairs. Now imagine flipping through hundreds of customers, opening your mind to the patterns that emerge. You could spot common behaviors, note irregularities, and build a close-up perspective of customers' actions. It is an exercise that every business executive should try: sit in a quiet, windowless room and look at visual representations of customer behaviors one at a time, deducing what their behavior implies about their needs. The results are eye-opening; customers are screaming out their needs through their behaviors. By seeing and appreciating these behaviors, a business has an opportunity to build a customer intimacy that too often gets lost.
Putting Customer Flashcards to Work
Finding new patterns can be interesting, but how do you quantify them? In our work, we develop pattern recognition algorithms to capture the behaviors that are first identified by eye. Behaviors are then tagged – each customer can be tagged with multiple behaviors. With this new quantification of customers, you are positioned to take action.
The value from customer flashcards can be both strategic and tactical. Here are a couple examples from our experience:
- A car rental company was able to tailor its offerings based on behavioral segmentation of customers. We visualized individual customer car usage, including where, when, and how long customers were driving. The customer flashcards revealed different types of trips (e.g., errand running around town, long trips) and different customer relationships (e.g., loyal repeat customers, trialers). These dimensions provided a rich landscape for ideas to match specific customer needs with promotions, pricing, and targeted marketing.
- In the credit card business, understanding cardholder risk is a key to profitability. To whom do you extend more credit? Which cardholders bring in steady interest income without fear of bankruptcy? Traditionally, credit card companies have built complex scoring models to segment customers based on their credit history and a snapshot of credit risk. Customer flashcards added a new and nuanced tool to these operational decisions. Trending of purchases, balances, balance transfers and available credit revealed a number of interesting behaviors. For instance, some cardholders were making big purchases on credit, then gradually paying down this debt over a series of months. Just as they prepared to pay off their balance, these cardholders would treat themselves to another big ticket item. Visualizing behaviors made this “sawtooth” activity obvious and gave the bank an ability to treat these customers with proper appreciation.
For those responsible for embedding business intelligence into the fabric of the organization, customer flashcards provide an immediately accessible and visually appealing way to engage senior executives. In addition, visual representations can create a common language for describing customers. The customer images let employees in different functions consider problems in the context of real, data-derived understanding.
Finally, we have found that customer flashcards are effective at unearthing data irregularities or process failures. When something doesn't look right in a picture of behavior, there is often something wrong with data quality, or with an internal process.
Reestablishing Customer Intimacy
Chris and I grew up in Lincoln, Vermont, a town of 900 people tucked away in the Green Mountains. At the center of this no-stoplight village is a general store. Vaneesa, the proprietor for more than three decades, greets her friends and neighbors at the counter everyday. She has grown to know each of their habits and needs and can tailor her stock and service in response. Everyone in town appreciates it.
This type of customer intimacy has long been lost as companies scaled beyond personal relationships. In an attempt to rebuild this bond, companies pile customer data – a digital representation of customers – into customer relationship management and business intelligence databases. Storing this information does little to get your business closer to understanding customer needs. Traditional data analysis falls short by aggregating behaviors and depending on the business to ask the right question. Surveying, another approach to staying in touch with customers, is hampered by customers’ imperfect knowledge of their own needs and by their limited memory of their own actions.
On the football field, a shared understanding and a targeted game plan are keys to victory. It’s the same in business. Customer flashcards can give you a new perspective on your customer data and help you succeed by knowing more.