Market Validation of a Data Product: A Story of Success

Juice has spent the last year and a half developing Blueprint and bringing it to market. It all started with the idea that we could monetize the data we have access to through our partnership with HealthStream, and create and launch something useful for our customers.

As we worked to bring this idea to fruition we put together a product roadmap of features we would like to see and ways that we think our customers would interact with it. We realized that it wasn’t enough to just put the data into Juicebox and throw some visualizations at it; we wanted to ensure we had a product that would sell, be easy to describe, and bring value to our customers. In order to do that, we established some phases that we needed to go through with the product to bring it to market.

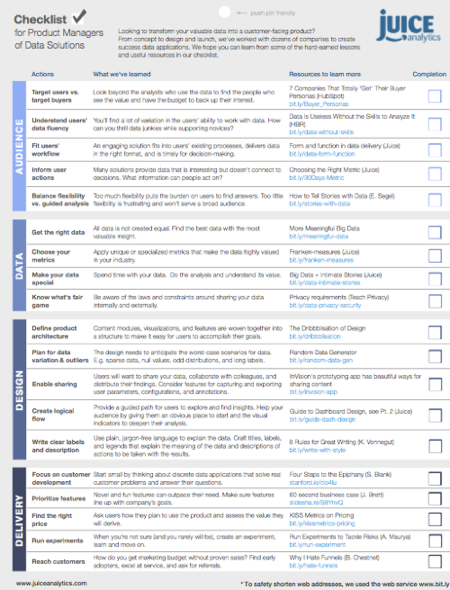
For the purposes of this blog post, I am going to just talk about market validation and the steps we took that you can incorporate into your own data product research.

Our first step in launching our data product was to validate some important things. Primarily, we needed to discover if there even was a market for Blueprint. We went about that a number of ways, and ultimately discovered that there was indeed a good-sized market. We researched who our potential competition was and studied their features to ensure that our product was unique enough to differentiate ourselves. This turned into a really valuable exercise for us as a team. We took the time to write out, brainstorm, and verbalize how we are different from others in our space. This was a vitally helpful step in the process to not only gel our team, but to get us all on the same page.

Secondly, we needed to validate that we had buyers! This was quite possibly the most important step, as we could have created the most stunning visuals in the world with the cleanest possible data, but without a buyer we would be left with only some fancy visualizations and no one to share them with (whomp whomp). We were strategic in our approach to finding the right buyer. We worked hard to understand industry trends, their pains, and craft Blueprint to make sure it met those needs.

We also had to understand our customers' motivation for buying Blueprint. Was it to fix an immediate problem? Address an issue coming down the pike? Or proactively equip their organization to make good decisions in the future? We found out all of these were motivations.

User feedback was vital for us in understanding if the end user of Blueprint was an organization, a person, or a group of people. We had to work through who we wanted our end users to be and settled on HR leadership as our primary users within a health system. We discovered that other executive leadership received value from insights into their staff. This turned out to be a discovery that led us to new customers. When reaching out to these groups of leaders we offered a demonstration of Blueprint and asked for feedback of what they would like to see in such an application. It was important for us to take their feedback and incorporate it into Blueprint, and then go back to them once it was completed to get more input. We also asked some of the individuals we interviewed and demoed for to be on our product advisory panel. Doing that gave us great insight on how to best design the product for the market.

Incorporate these steps into your own data product market research, and you're well on your way to your first sale!

Here because you want to know more about Blueprint? Ask us your questions and see how it works by setting up a time to talk!

Turning Healthcare Workforce Data from a Challenge into an Asset

“Since people are a huge investment, the hospital needs to make sure that it’s hiring and retaining the best people. Once hired, though, how does a HR leader keep an enterprise view of the workforce, and how do they identify problem areas quickly?”

It’s a tricky question, and it’s the one we set out to solve when we created our latest product, Blueprint.

If you’ve been paying close attention to the Juice blog, you might have noticed we’ve been talking about Blueprint quite a bit lately (see here, here, and here). Each one of these posts has featured a different aspect of Blueprint, depicting a small sample of its various features and demonstrating its ultimate purpose: to provide HR leaders with an easily accessible enterprise view of their workforce in order make better data-driven decisions.

Michael Dean, Juice’s Director of Business Development, sat down recently with HealthStream to further discuss Blueprint’s features, provide more information about who might most benefit from it, and share some examples of Blueprint in action. Download the latest issue of PX Advisor, HealthStream’s online magazine dedicated to improving the patient experience, to learn more about how Blueprint might be the perfect fit for your organization.

Done with reading and want to get an up-close look at Blueprint for yourself? We’d love to show it to you! Send a message to info@juiceanalytics.com or set up a demo below.

Image Source: http://www.healthstream.com/resources/px-advisor/pxadvisor/2017/02/10/winter-2017

Taking Your Organization’s Pulse with Workforce Analytics

What is the first thing that comes to mind when you hear the word “healthcare”? Is it an image of an industry dedicated to patient health? Or do visions of budget cuts and federal mandates dance in your head? My bet is on the latter.

Whether you’re a healthcare employee or not (and whether you like it or not), you’re still a part of the healthcare industry. And we can all probably attest to associating “healthcare” with an industry encumbered by increased demands and limited resources, instead of one that is focused on the health and wellness of patients.

Whatever your political and personal stance, I think we can all agree that patient care should be at the forefront of the industry’s focus. But with increased demands and a tightening resource base, how can this be accomplished?

It’s a basic economics principle – the only way to do more with less is to change the way things are being done. This means challenging the traditional approach. One CIO article went as far as to compare healthcare to Blockbuster, suggesting that the industry is in need of a “Netflix-type” level of disruption. Unfortunately, trying to compare the model intricacies of healthcare delivery with video rentals is like comparing the complexities of the human body with that of a VHS tape (one is a little more complicated).

However, I think we knew where the article was going with this analogy, and that the takeaway is the need for a new approach. But with a multitude of different interventions and efforts currently intertwined and underway, the question is, “Where does one start?” For an industry in need of determining which piece of the puzzle to focus on, it would make sense to consider where the largest investment lies. For healthcare? That’s staffing.

Hospitals invest millions annually in financial and clinical IT systems, but tend to spend much less on "the people side of the business.” Staffing expenses currently make up over 54.2% of a hospital’s overhead costs, and staff-related expenses can cost upwards of 70% of an organization's total costs – easily the largest expense line item on the books. Furthermore, healthcare employment is projected to grow 29% by the year 2022 according to the Bureau of Labor Statistics. That’s twice as fast as the expected overall employment growth!

Perhaps the most important reason to focus on staffing practices is that they have been shown to have a direct impact on patient satisfaction and outcomes, with considerable amounts of research linking staffing variables to patient outcomes. In other words, happy workers equal happy patients equal happy profits.

Fortunately, what we’ve learned through the development of our analytics platform, Blueprint, is that it does not take a whole lot of complex workforce data to begin measuring staffing areas that are directly tied to quality of care and cost management. Below is an example of some of the strategic areas on which Blueprint focuses. Give these data-driven efforts the attention and resources they deserve, and you’ll be moving towards better clinical and financial outcomes.

  • Turnover Calculations - Replacing a valued healthcare employee can cost up to 250% of the employee’s salary. According to an NSI study, 83.9% of healthcare respondents don’t record the costs of employee loss. With the report finding that the vacancy rate for nurses is expected to grow, hospitals need to do all they can to keep retention high to avoid a lapse in patient care quality and a need to increase clinical workloads even more.
     
  • Retention and New Hires - Mentioned above, retention can provide the continuity of care that plays a large role in clinical care and patient satisfaction. Furthermore, employees with less than one year of tenure make up nearly 25% of all healthcare turnover nationally(!) 

    Try tracking turnover in groups by tenure such as 0-3 months, 3-6 months, 6-12 months, >1 year, etc. Reporting the data in cohorts will make it easier to pinpoint where in the lifecycle the attrition is occurring.
     
  • Managerial Span of Control - According to studies, smaller spans of control are linked to higher rates of employee retention – and the alternative being true with wider spans of control.

    Use supervisor/employee data to compare the number of direct reports by hierarchy level. Spans of control should be similar for supervisors in the same hierarchical level, with the exception of differences in direct report skill level, experience, and tasks performed.
     
  • Staffing Ratios - Staffing ratios define the relationship between your revenue-producing employees and the staff needed to support them. According to the Agency for Health Research and Quality (AHRQ), the risk of nurse burnout increases by 23% and dissatisfaction by 15% for each additional patient. However, when hospitals have accurate staffing, nurse burnout and dissatisfaction can drop significantly. Studies suggest that the higher the ratio of support staff per FTE physician, the greater the percentage of medical revenue after operating cost. Health systems with higher nurse employment had a 25% lower chance of receiving penalizations for readmissions through HRRP than those that had lower nurse staffing levels.
     
  • Leverage Your Internal Resource Pool - With an enterprise view of your staffing needs, it’s easier to make strategic staffing decisions for the entire organization, enabling you to find that sweet spot between optimal care delivery and labor cost management.

    Begin by analyzing data that represents staffing by facility, specialty, and department, while considering patient needs and the corresponding staffing data across the organization. Monitor staffing distribution and find opportunities for reallocation (as opposed to hiring/terming) with staffing surpluses and shortages.
     
  • Strategic Staff Allocations - Employ known enterprise concepts, such as economies of scale by identifying opportunities where you have a concentration of facilities in a given geographic area. Also, back-office, phone clinical roles and administrative functions, such as billing and purchasing, can be streamlined with centralization efforts that leverage economies of scale.

    When faced with healthcare’s “do more with less” dilemma, it is an opportune time to rethink how we approach labor cost containment and quality of care improvement strategies.

In the midst of healthcare reform and quality care initiatives, healthcare systems have an opportunity to place patient care back in the forefront of the healthcare delivery model. By recognizing that the missing link between quality of care and cost containment is the healthcare workforce, they will be doing just this. After all, people are at the heartbeat of healthcare -- patients and staff.

Let us help you keep your finger on the pulse of your organization and visualize your data in way like never before. Interested in learning more about a one-stop-shop for workforce analytics? Send us a message to get a preview of Blueprint.


Lessons from a Data Monetization Workshop

Data monetization is a hot topic. And like the early days of ‘big data,’ there is uncertainty about what the term means and the opportunities it creates.

Nashville’s data community came together a couple of weeks ago to push the data monetization discussion forward. My friend Lydia Jones, founder of InSage, put on the second annual Data Monetization Workshop. She gathered industry leaders from as far away as Australia for a half-day event that shared real-world experiences and raised important questions about how to think about your data as an asset.

I was happy to participate in a panel called “The Arc of the Data Product” — a familiar topic as we work with companies launching data products on our Juicebox platform. Here’s how I like to frame the undercurrent for data products:

Whether it is Fitbit’s personal health dashboard, smart routers, or an analytical dashboard for a SaaS product, data products are about enhancing your existing products to make customers smarter, more engaged, and (hopefully) more loyal.

Creating data products is seldom a linear process — but for the sake of discussion, I laid out the common steps involved with bringing a data product to market. 

The discussion on our panel — and the remainder of the workshop — was wide-ranging. Here are a few of the important takeaways from the conversation:

  • We need to consider both the direct and indirect business models for data monetization. Direct — selling your data to other organizations, through brokers or marketplaces — is still an emerging model. Nevertheless, several people at the workshop expressed interest in how this data would be valued. Indirect data monetization — creating new products and features from the data — seems to me a more established path in part because it sidesteps challenging questions about data ownership. Like the oil industry, there will be those who make money through the raw materials and those that add value along the many steps in the value chain.
  • The hard work is in getting your data right. Many organizations are tempted to race ahead to building data products without realizing they are building on an unstable foundation. Any issues involved with gathering, cleaning, or validating your data will inevitably be revealed in the process of launching a data product. 
  • How do you deliver value from your data early, so you can buy time to get to long term solutions? This was a common refrain from the data professionals who had been stung by executive teams impatient for results. However, in the eagerness to deliver value from data, I reflected on the inevitable: if you build it, you own it. Even the smallest data report can become an albatross around your neck if customers come to depend on it.
  • Data products come in many forms: an insightful report for your customers, a feature that recommends useful actions, or a stand-alone analytical solution that transforms how your customers make decisions. Regardless of the form, they are products that need to be researched, tested, marketed, sold, supported, and refined.

To learn more about our experience with building and launching data products, here are some other resources:

Data Product Resources
How to Build Better Data Products: Getting Started
Data is the Bacon of Business: Lessons on Launching Data Products

Want to build a data product? Don't take inspiration from an El Camino

You’ve connected your data highways, built the bridges, and now it’s time to take a ride. Do you have the right vehicle? Do you even have a vehicle?

Hopefully you’ve put some plan in place to extract value out of your information highway. If not, may God have mercy on your soul and the executive who decided to fund your bridge to nowhere. Most likely you know what it is you hope to get out of your “Big Data” investment, but there are a lot of unanswered questions.  

At this point you’re faced with what I like to call the “Chinese Buffet” of data analytics vendors. Do you really want to eat pizza, chicken tenders, and Kung Pao chicken all in one sitting? This infographic looks a lot like a “Big Data” buffet and proves how overwhelming the vendor selection can be:

https://www.capgemini.com/blog/capping-it-off/2012/09/big-data-vendors-and-technologies-the-list

https://www.capgemini.com/blog/capping-it-off/2012/09/big-data-vendors-and-technologies-the-list

It’s no surprise why it’s so tempting to try to whittle the selection down to one vendor that does it all. You’ve convinced yourself that if you select one vendor, this decision will save money and eliminate the potential indigestion of integrating with multiple vendors from the Big Data buffet.

This can prove to be a fatal decision, especially when the solution you’re trying to build has a revenue target pinned to it. Some of you may already be familiar with the infamous Chevy El Camino. For those of you who aren’t, it’s the truck/car hybrid that’s about as appealing to look at as the mutant puppy/monkey/baby courtesy of last year’s Super Bowl commercials:

The El Camino was the ultimate utility play for people who wanted something that could haul like a truck yet still ride like a sedan. It was a one-size-fits-all solution for motorists, but unfortunately it was neither a great sedan nor a good truck.  

Let’s imagine for a minute that you’re in the construction industry and competing for a bid to deliver construction materials. The job is 1 mile off-road in the mountains and the prospective client asks what kind of vehicle you’ll be using to deliver the materials. You tell the client “I’ve got an El Camino, it’s a car with a truck bed!” Your competitor submits a bid and tells the client they’ll be using a F350 Super Duty V8 4x4. Who do you think wins that bid?

How does this relate to your problem? Let’s imagine now that you’re building a data product. Many vendors in the data analytics space bill their products as a one size fits all solution, like the El Camino.  Picking one vendor to do everything can leave you with an undersized and underperforming platform.  

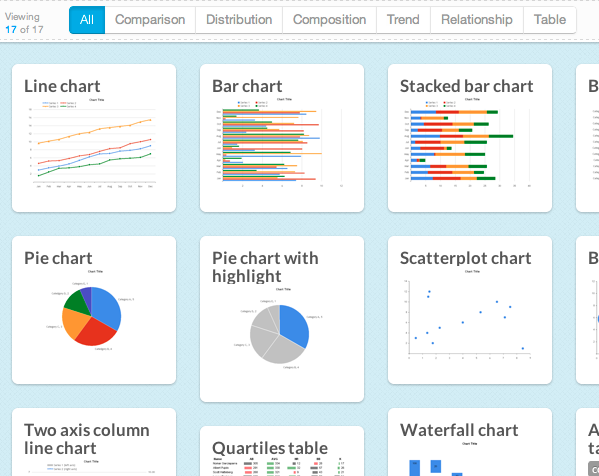
For example, your client may have asked for both an executive dashboard and unbridled access to your data so their analysts can perform ad hoc analysis. You go out and find the most whiz bang drag and drop analyst friendly chart builder. It has 80+ visualizations (half of them are 2-D and the other half are 3-D) so your client can dig in and make all the 3-D pie charts they ever wanted. The vendor also claims to have an awesome dashboard solution.  You go to build your executive dashboard and it looks something like this:

https://blog.rise.global/2015/10/28/the-5-big-design-decisions-you-need-to-make-when-creating-a-personal-dashboard/

https://blog.rise.global/2015/10/28/the-5-big-design-decisions-you-need-to-make-when-creating-a-personal-dashboard/

The vendor you selected gave you a great ad-hoc tool, but their data presentation/communication platform is seriously lacking. Your potential client takes one look at your platform and decides they only want to pay for access to your data at a fraction of what you hoped to charge for your product. You’re stuck in the mud with an El Camino full of data bricks.  

It’s worth noting that the executive dashboard is for executives and the ad-hoc tool is for analysts.  Last time I checked, executives were the ones who were responsible for cutting checks.  

It’s always important to pick the right vendors for any job. Don’t expect to find a one-size-fits-all tool in the Big Data space.  When building a data product, remember that the presentation of the meaning, flow, and story of your data is more important than any ad-hoc capabilities. If you fall short on effectively communicating the value of your solution, you may soon find yourself standing alone on that bridge to nowhere.

Need help finding the solution that best solves your data problems? Check out Juice's new tool, the Buyer's Guide to Analytics Solutions. 

A New Juice Tool for You: Buyer's Guide to Analytics Solutions

At Juice, we like to create useful tools for our readers. Here favorites seem to come out every two to three years:

The data and analytics space is a confusing place, densely populated with dozens and dozens of vendors, each one claiming they alone can solve your problems. But who’s really offering the right tool for your situation?

Big Data Landscape, Matt Turck 2016

Big Data Landscape, Matt Turck 2016

Our Buyer’s Guide is designed for technology decision-makers who are trying to make the most of their data. Whether you are looking to analyze large data sets, map location data, or build visualization tools for your customers, we’ve done the dirty work of scanning the landscape and categorizing what we found. We’ve categorized the more than 100 analytics solutions into 19 categories of tools.

We start The Buyer's Guide with a question about your end-user.

We start The Buyer's Guide with a question about your end-user.

The Guide is a decision tree where you answer questions about your needs, and each answer leads you down a path toward the right type of analytics solution. Think of it as a "Choose your Own Adventure" book where your happy ending is the best tool for the job. For each category of analytics tool, we’ve tried to compile a comprehensive list of providers. 

After navigating the choices available to you, you will have the option to submit your results. If you’d rather keep your results private, no problem. For those who submit their results and email, we’ll send you our three most popular white papers and include you in our monthly newsletter. 

If you find that we’ve missed analytics vendors that you are familiar with, send us a note at info@juiceanalytics with the subject line "Buyer’s Guide". 

New Year's Data Resolutions

I am oftentimes on the front lines of receiving emails and calls from people interested in what Juice does, what we think, and what we have to offer. Most of the conversations I have are exploratory in nature where someone is reaching out to see if Juicebox would be a good fit for the project they are thinking about. From my experience in having conversations with companies that are working on a data project, I have noticed a few common themes.

  1. Companies are usually good at collecting data, and with modern technology it is relatively straightforward. Cloud storage is easy to obtain and becoming cheaper, but organizations struggle with the presentation of that data. (Hint: We can help with that!)
  2. Most companies have a way to access that data, but often they may not know where it is or what department or manager has access to it.
  3. There is usually one person who has the vision to bring all of it together in one place, but he or she doesn't have to support to bring the project to life.

Knowing that we can help, that person and I usually discuss what it would take to get the project off the ground. I usually hear "We have been talking about this for a long time, it is a headache, but no one will own it." I reply with, "What is stopping you from owning this and starting your data project?"

Since it is the season of New Year's resolutions, I will pose the same question to you. What is stopping you from starting your data project? Is it ownership, complexity, or maybe even leadership? Whatever it is, it is time to start. As organizations grow, complexity increases, making it more difficult. Now is the time!

There are hundreds of articles out there about data and the business value it can offer an organization. If your problem is leadership, I recommend putting together a business case as to why your organization needs to do this. The amount of time and labor to bring that data into an organized, aggregated fashion is often constrained by the amount of time available and the fact that no one has ownership. 

It usually isn't a matter of technological constraints because there is a myriad of technologies out there to gather, store, organize, disseminate, and present data. Usually it is a matter of becoming organized and the time commitment necessary to complete the project. Often there is one person who has all the relevant knowledge about where the data is and what format it is in. I recommend buying that person lunch and picking their brain about the problem. Chances are they already have some ideas about how it can be solved.

So go ahead, impress your boss, start that data project you've been putting off for months!

Have questions about starting your data project? Don't hesitate to reach out! Get in touch with us either via email at info@juiceanalytics.com or send us a message.

Battery Meters and the Goldilocks Problem

"Actionable data." It is a phrase well on its way to becoming a cliché. But clichés are often founded in truth, and it's true that the essential quest in analytics is finding data that will guide people to useful actions.

Apple’s battery meter offers a lesson in the challenges in delivering such actionable data.

The battery meter on Apple's new Macbook Pro included an indicator of the estimated battery life remaining. If you’re sitting on an airplane hoping to watch a movie or finish your blog post, time remaining is a critical measure and a source of stress. But Apple faced a problem with presenting the time remaining value. According to The Verge, “it fluctuated wildly on Apple’s newest laptops...the ability of modern processors to ramp power up and down in response to different tasks made it harder to generate specific, steady estimates.”

Marco Arment put it in simpler terms: "Apple said the percentage is accurate, but because of the dynamic ways we use the computer, the time remaining indicator couldn’t accurately keep up with what users were doing. Everything we do on the MacBook affects battery life in different ways and not having an accurate indicator is confusing.” 

It's an issue of excess precision. Users want to know a precise time-remaining answer, but the fundamental nature of the machine results in a great deal of variance. I first heard about this problem from the excellent Accidental Tech Podcast. During the discussion, John Siracusa suggests an alternative to the problem: a burn-down chart like the kind used in agile software development. Android phones offer something that looks a lot like what he describes.

Siracusa admits that a more detailed visualization of this nature probably isn’t for everyone. It may work for him (and I like it a lot), but not everyone spends their days visualizing data.

It's a classic Goldilocks problem. Too little detail (and too much precision) can be deceptive and difficult for users to understand when the number jumps around. The lonely key metric without context can be inscrutable.

Too much detail, such as in the form of a full-fledged chart, may be more information than the average user wants to know. The predominant feature of the chart, the slope of the trend, isn’t fundamentally what the casual user cares about. They want to know if the battery is going to still have life when they are getting to the exciting final scene in their movie. Data visualizations should not be engineers serving engineers (as I noted when Logi Analytics asked that Fitbit embed a self-service business intelligence dashboard in their apps).

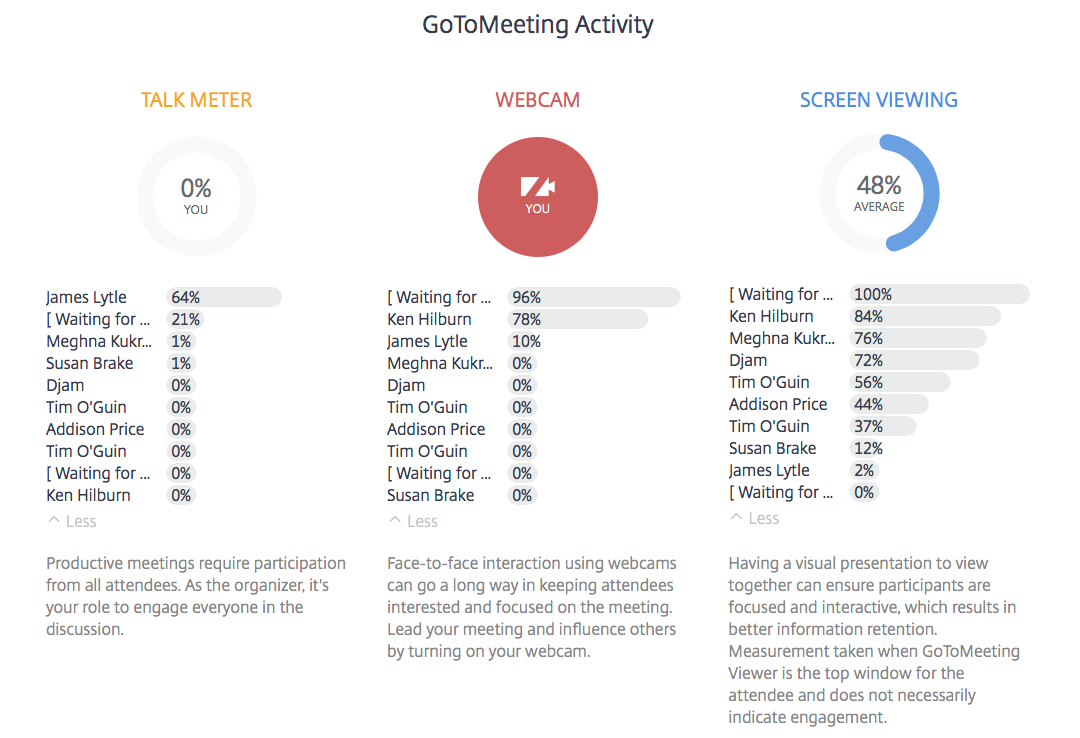
There is a third option available -- a "porridge that's just right." The alternative is to jump straight to solving the user’s problem while still using data. The data or metric itself isn’t the point; the user’s goal is the point. A better solution for Apple might look like this:

When it comes down to it, the problems Apple faces with its battery life estimates aren't so different from the problems we all face in delivering actionable data. The solution can be boiled down to a simple formula: Use the data to solve the problem. Keep the user informed. Give them a smart choice. 

And always have your charger handy, just in case.

Thirsty for more? Check out these related blog posts:

Leveraging Data to Generate Value

Lydia Jones is a business and legal data monetization strategist and adjunct professor of law at Vanderbilt Law School and Boston University School of Law. Lydia and her consultancy firm InSage LLC are the 2017 producers of The Data Monetization Workshop, an annual event that brings together industry leaders and data monetization innovators to discuss data-centric opportunities, address perceived challenges, and transform the C-Suite conversation.  Learn more and register for the Workshop here.

You have defined data monetization as "leveraging data to generate value." I'd like to explore more about what you've learned as you talk to companies looking to get value from their data.

The role of Chief Analytics Officer or Chief Data Officer has become increasingly common as organizations try to focus their efforts on data monetization. From your experience, what kinds of companies have pursued this strategy and established this data leadership role? That is, what conditions need to be in place for a company to pursue this type of innovation?
I look at the data-centric ecosystems that exist in the private sector as broadly as possible, and that includes looking at how private companies are working with local governments to leverage data and to generate value for public goals as well. So to start, companies willing to learn from,  or collaborate with, entities outside of their core industry is one condition. Another condition includes a willingness to view data as a business opportunity rather than as just a cost item in the CTO’s budget. Once data and data-centric revenue are seen as crucial parts of business operations, focusing on data opportunities analysis is key, and having the right skill set for that task is even more so. The shift from data as an anchor to data as an opportunity typically moves a company to consider whether, and when, to create a Chief Analytics Officer or Chief Data Officer position to address opportunities, to leverage data, and to generate value for the company, its partners, and its customers.

What kinds of distractions have you seen that may give a company pause in either creating a data leadership role or pursuing innovative data-centric monetization thinking?
A change in perspective about opportunities that may arise from data collection, data sharing, and data analytics, or from the creation of a new position such as a Chief Analytics Officer of Chief Data Officer, is not enough to fully leverage data monetization initiatives. A company must also change the internal conversation about perceived risks concerning data value and data monetization. Many companies misperceive risks, such as privacy risks, when valuing data and when assessing whether to engage in innovative data monetization initiatives. Companies that have opportunities to leverage data must resist being swayed by misperceptions about privacy. For example, many companies have a blanket rule against monetizing personally identifiable information. While this may be the prudent choice under some circumstances, many companies adopt this position as an automatic universal rule because of a perceived, but oftentimes unfounded, risk concerning privacy. For example, data monetization opportunities arising from the collection and sharing of personally identifiable wellness data are routinely rejected under the perception that privacy rules – such as those found in the HIPAA Privacy Rule applicable to personally identifiable health data – prevent the monetization of wellness data when in fact those rules usually don’t.

This kind of thinking based on misperceived privacy risks undermines innovation. One need only look at the popularity of mobile applications through which consumers pay to give real-time generated personal data –  from retail purchases to geolocation data to biometric data – to companies in exchange for data analytics and insights. When consumers are demanding highly personalized products and experiences, it becomes a necessity for a company to consider, or to reconsider, how to best generate value from personal data. Yet for those companies that misperceive the risks associated with data monetization, these opportunities are left to competitors.

Can you share a few examples of the kinds of entities that you think are doing innovative things with data and data monetization?
Innovative data-centered projects span across the corporate sector, the nonprofit sector, and the local government sector.  Big Data Quality recently published Big Data 50 -- Companies Driving Innovation
, which is worth checking out here. And in the nonprofit sector, data scientists are moving into the role of the chief data officer. DoSomething.org is an example of a nonprofit that hired a data analyst for the dual role of data scientist and chief data officer nearly three years ago. Finally, in the local government sector, we are seeing innovative leaders creating the chief data officer position to support data-driven strategies aiming to serve public goals such as increasing efficiency in public education, fire safety, and public health. In fact, Nashville just joined the short list of innovative cities – including Boston, Chicago, New York and Los Angeles – when it hired its first Chief Data Officer, Dr. Robyn Mace, in 2016.

Looking forward, 2017 holds significant promise for companies willing to engage in proactive data monetization discussions that redefine data monetization as “leveraging data to generate value,” that thoughtfully consider and assess perceived privacy risks, and that consider data as a corporate asset to expand business opportunity and competitive advantage.


Book Review: "Bringing Numbers to Life"

"The effort was none other than to do the hard work of bridging numbers and people, and building that work into products that entice, even seduce, skeptical users to invest in an unfamiliar activity."

In his new book "Bringing Numbers to Life",  John Armitage sets out to create a design framework for analytical apps. It is a worthy subject and one that is close to home for our Juice team.

Mr. Armitage’s book has been published online and free-of-charge by the Interaction Design Foundation. The Foundation’s founder, Mads Soegaard, shared their vision: "We offer complete, unrestricted and free access to our chapters/books/textbooks in online versions. Everything we do is a labour of love and not a business model. We walk the talk of altruism.” The IDF hosts a wealth of free materials and textbooks, with contributions from top academics and professionals.

The book is a worthy subject delivered by a worthy organization. I was happy to share my thoughts.

"Bringing Numbers to Life" describes the how, what, and why of a “design-led innovation in visual analytics. The author is a lead designer at SAP (update: John Armitage is now head of UX design for Host Analytics), the software behemoth and vendor for such business intelligence products as BusinessObjects, Lumira, Roambi, and Crystal Reports. He was charged with creating a unified design model across these products to make them more effective in the communication of data. In his words:

“The result of this effort was a number of prototype projects that led to LAVA, a design language for visual analytic environments intended for broad application across the SAP product suite. The key driver behind LAVA was simplicity and low cost, which translated into some fundamental innovations that, with the backing of a large company like SAP, stand to improve the clarity and reach of visual analytic consumption in the workplace and beyond."

The analyst’s office is filled with books by Edward Tufte, Stephen Few, and Alberto Cairo providing guidance on how to visualize data. But what about the designer or developer of analytical solutions? Their challenge is in many ways more complex.

Armitage makes an important distinction between “Artisanal" and “Production" solutions. It is one thing to craft a one-off visualization solution for a specific purpose. In these cases, the author knows the data, the audience, and the specific message they want to convey. His challenge is to develop a system that can repeatedly deliver high quality data visualization and analytical tools. It is the difference between the carpenter who can craft a single table and the engineer who can create a factory that delivers a thousand tables. The requirements, skills, and frameworks are very different.

Armitage has researched this topic thoroughly. Over many years, he worked with internal SAP teams and consultants to define and refine his LAVA (Lightweight Applied Visual Analytics) framework. His framework describes important pieces for any analytical solution, and how these pieces should fit together. While he defines a specific nomenclature, the elements are universal building blocks. A few examples:

  • Charts can exist at different levels of detail and fidelity. When we want to represent a concept, it may appear as a single number or sparkling (“micro chart”) or a fully-labeled trend chart (“chart”) or as part of a multi-component, interactive visualization (“meta chart”).
  • Analytical tools need a hierarchy of components that allow a user to consider a broad concept, drill into more detailed topics, and explore specific data.
  • Modern analytical applications need to offer much more than the visualization of data. Features for sharing, collecting insights, and personalization are necessary to deliver a complete analytical tool.
  • The traditional single-page dashboard design is antiquated. "Scrolling effectively increases the virtual size of your display outside the borders of your window or device, and is a basic convention for digital content consumption that has been ignored in traditional dashboard design."

Armitage is also a critic of the increasingly complex and bloated analytical solutions — something I hear more and more from companies frustrated with visual analytics tools like Tableau.

"Currently, however, most visual analytic solutions reflect previous efforts to serve large high-paying enterprise customers, and are thus bloated with features designed for highly trained – and high-paying – specialists. As Clayton Christenson’s principle, and associated book titled The Innovator’s Dilemma tells us, companies in such high-margin businesses are beholden to serving their large customers, and thus leave the low-end of the business exposed to inroads by newcomers to the market. Visual analytic market leaders are facing such a dilemma today."

Despite my fondness for the topic and appreciation of Armitage’s evident research, the book has issues that I found hard to overlook.

Armitage indulges in lengthy tangents, personal biography, and an obsession with the specifics of the SAP landscape and politics — providing us with sentences like this:

“I even produced a farcical off-site video on the theme of multinational collaboration, and a comedy routine – based on the famous “Who’s on First?” from Abbot and Costello – to poke fun at working in multinational teams. I performed the latter live with Jay Xiong at our 2012 office holiday party in Shanghai."

He also appears to be fighting a public battle with the leadership of SAP to adopt his LAVA model in the pages of his book:

"Although LAVA, in particular the Lattice, pointed to similar effects for quantitative data, it was difficult for some people who were particularly close to BI to acknowledge its potential. The definitive objection from this faction was that LAVA “does not match Our metaphor”, which was of course precisely the point. LAVA is a new metaphor, and one that’s necessary for achieving SAP’s product aspirations."

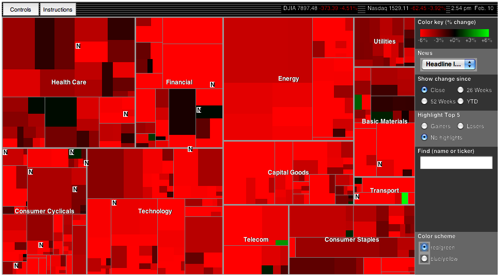
I have a deeper concern with some of the recommendations for visual solutions. One of the features concepts is a "Lattice chart”. I found the example provided to be confusing and complex. Designing visualizations is an exercise in finding simplicity and accessibility for your audience. The image below is crammed full of information, but lacks the legend or space for a typical user to know what it all means.

Perhaps my biggest concern is with Armitage’s long-term vision. He expresses a desire to create an analytics world where human intervention isn’t necessary to communicate data effectively.

With this scalable framework in place, we can start to dream of efficiencies on a large scale, with entire Board Sets generated automatically from adequately-provisioned data warehouses. Filters, Panels, and Lattices can be determined with a rules engine automatically from combinations of Measures and Dimensions. Galleries can be populated by algorithm-generated charts derived from the most relevant Lattice Layers. Points can be created from data set indexing and data mining, and populated with major category representations and outliers. Multiple data sets can be organized into groups and presented as Board Sets, or one giant data set can be subdivided into Boards according to individual or sets of Measures or Dimensions, with these Boards further subdivided into Categories and Lattice stacks according to the depth and complexity of the data. These efficiencies will allow more people to use data to make decisions, and require fewer people to support them.

In my experience, data communication needs to start with an intimate knowledge of the business context, an appreciation for your audience, and an understanding of what it takes to make them more effective in their jobs. These aren’t things that can be scraped from a database.

Philosophical issues aside, this is a book about Armitage’s journey in trying to change how an organization delivers analytics, his process and research, and the quite-useful framework that came from his journey. As someone who has tackled the same design challenges in creating a new kind of tool for visualizing data, I appreciated being able to get an up-close view of how another professional wrestled with common challenges.

In describing his conclusions, John Armitage notes, "During LAVA’s development, I found myself surprised that nobody had before arrived at our fairly simple and basic conclusions."

Don’t worry, John, you’re not alone.