A Checklist for Creating Data Products

“Data is the new oil.” -- everyone (first by Clive Humby)

"Treat data like money." -- Jim Davis (SAS CMO) in The Economist

Are you are sitting on a gold mine -- if only you could transform your unique data into a valuable, monetizable data product?

Over the years, we’ve worked with dozens of clients to create applications that refine data and package the results in a form users will love. We often talk with product managers early in the conception phase to help define the target market and end-user needs, even before designing interfaces for presenting and visualizing the data.

In the process, we've learned a few lessons and gather a bunch of useful resources. Download our Checklist for Product Managers of Data Solutions. It is divided into four sections:

1. Audience: Understand the people who need your data

2. Data: Define and enhance the data for your solution

3. Design: Craft an application that solves problems

4. Delivery: Transition from application to profitable product

Happy drilling.

JuiceChecklist-ProductManager

JuiceChecklist-ProductManager

More meaningful Big Data

From time to time we call in some data muscle to help on a project or to brainstorm about a problem.  Harold, Amanda and Sean at Five x Five have been awesome data resources, colleagues and valuable part of our little Atlanta Data Village.

Here is a link to their website as well as the meaning of Five x Five in case you don’t know.  Great name for a data company.  We finally convinced Amanda to write a blog and share some thoughts.  Enjoy!

--------------------------

Needle In A Haystack

“I have all of this data, but nobody knows what to do with it.”

We hear some version of this phrase, often with a heavy dose of exasperation, during preliminary meetings with nearly all of our clients.

The vast amount of data – be it transactional, customer-level, sku, property, etc. – available these days can be as much a source of stress on marketers as it can be valuable. “Big Data” is now practically a household term, but what do we DO with it? How do we make it manageable?

Smaller, manageable and meaningful

For us at FIVExFIVE, data is all about delivering meaningful insights through segmentation, prediction, and optimization.  The reality is that before we can get to any “fun analytical stuff”, we spend about 80% of our time on exploration and cleansing – discovering the “smaller, manageable, and meaningful” Big Data

Here is a small flavor of the steps to get your data ready.

Data Validation

  • What is a unit? (e.g. transaction, customer, product sku)
  • How many records do we see vs. expect to see? (Important when importing/exporting)
  • Is our data unique by unit? Unit + time? Unit + time + space? Etc.
  • What level do we need for our analysis? E.g., should “transaction” level data be aggregated to person? Store? Product? Property?

Pattern discovery

  • Displaying distributions to identify outliers, or vast differences in group sizes
  • Graphing networks to uncover clusters of data
  • Uncovering patterns in time, space, or multivariate relationships

Data Cleansing

  • Standardizing formats (e.g. date, region names)
  • Removing/Replacing invalid characters, or characters in numeric data
  • Determining the difference between “missing” and “zero” data
  • Code verification (e.g. frequency tables for dummy variable creation)

Data Analysis

  • Segmentation (grouping units into homogeneous groups)
  • Relationship between dependent variable and covariates, if prediction is the goal
  • Choosing statistical methods depending on relationships and distributions
  • Determining optimal mix of decisions to achieve goals (minimize, maximize, etc.)

Variable Reduction

  • Correlations to discover redundant or nearly redundant variables
  • Factors/Proxies

Once your data has been cleansed and processed, you then try to answer some of the BIG questions. What will be actionable, interpretable, and relevant? Its only after you figure out the relevant questions can you then begin to narrow down the sometimes thousands of columns to determine what really drive business results, satisfaction or profitability.

But wait, there’s more.

Even after you’ve made sense of the data and developed an analytical solution, you’re not finished.  You have to visualize/present the results in a way that the decision-makers value the analysis, make a decision, and want more.  Keeping it simple, and saying as much as possible with as little clutter or extraneous displays of data is an art. Trust us.  It isn’t easy for statisticians to admit this, but delivering beautiful, much appreciated visualizations is as much fun (and valuable) as the modeling terabytes of segmentation data.

Marrying all these disciplines and steps is what has to be done to turn your Big Data into the Best Data.

Have a perspective about “the process” that differs from ours? We’d love to hear your thoughts.  Drop us a note at info@fivexfive.com.

Are you ready for some... data?

If you haven't noticed via various posts and examples, like our Fantasy Football Leaderboard, we are big sports fans.  Over the past year we've gotten to know Ryan McNeil (a former NFL defensive back) pretty well. Learning about the subtleties of college and professional football, as well as sports media, has been fascinating.  As you will see below he is very excited about the new season and the opportunities for better use of data in the profession. Or it could be just that his Hurricanes are currently 3-0. Enjoy!

Football stuff
Football stuff

I love this time of year.  The anticipation of the first week of NFL football always gets my “juices” (pun intended) flowing.  I’ve been astonished by how much data has changed the game since my playing days.

While Sabermetrics, APBRmetricsMoneyball and sports analytics conferences are now well known, the use of data in sports is still in its infancy. The use of information is still exclusive to team leadership (owners, GMs and coaches) and their analytics team. The next wave of data in football and all sports is just starting and ironically I have the same feelings of anticipation as if a new season is just starting.

The next wave is the use of data across many new audiences including agents, players (professional, college and high school) and fans.   This doesn’t mean that we’re going to turn them all into data scientists or that soccer moms will be sharing their R analyses with coaches, but it does mean that data becomes a much bigger part of the sports conversation.

The greatness of football (and sports in general) goes beyond the game experience itself; we also love the conversations, bonds, and memories that are created at every game. What I’ve learned over the past couple of years, particularly being so involved in the media business, is that enhancing these conversations among players, between players and coaches, between agents and teams, and between teams and their fans enhances the sports experience.

So, what has to happen for this next wave and these conversations to take place?  First its not about just giving everyone a new playbook or raw data, but delivering data applications.

A data application is a focused solution that attempts to answer one question or explain a single idea.  Questions like:

Data applications often benefit from being available on mobile devices and should be visually engaging, leveraging the latest data visualization techniques.

Visualization is the WOW factor.  It can engage players to better understand coaches and agents.  It can improve younger players learning curve. Have you ever seen the three ring binders we got to learn plays? For the fans, it can further draw them into the details of the game.

Another kind of visualizaiton

The season of data is only beginning and it’s very exciting. I’d love to hear what you think some of the data applications should be as well as what questions need to be answered to get players, agents and fans more engaged with data.  Email me at rdmcneil@ot-network.com.   I’m anxious to hear what you think. Now, are you ready for some football?

Make your text readable with 4 easy tips

What we didn't learn in school

Ever feel like your great data communication documents don't quite live up to the standard of readability you've developed for your data visualizations? You're not alone. Somehow, most of us were never trained either in the education system or in our professional careers on how to properly format our text. As a result, it's oh so easy to just use whatever Word or Google Docs tells us to (you know you've done it: Courier New, anyone?)

That's why Juice created the Simple Font Framework. It's four simple steps to formatting headers, text body, notes... the works... so that it's clean, readable, and beautiful. Interested? Check out the video here:

Now, once you watch that video, you'll likely have your curiosity tweeked, so we're including a another video for more in-depth font-a-licious information on understanding the mysteries of fonts (like: what exactly does "sans serif" mean?)

Now, what are you waiting for? Go make your text look great with Juice's Simple Font Framework!

Be a Data Presenter

gifting JUICE
gifting JUICE

As you can imagine many of the clients and people with whom we interact on a daily basis are data analysts or some form of analyst in one way or another.   I’m amazed how we are still learning about new tools and data “tricks” all the time from the folks we meet. These are all very smart and talented data savvy individuals, but is being an analyst enough?

It’s tempting to lock our minds and bodies into our comfortable air-conditioned cubicles and churn numbers and crunch data all day long, and then lob it over the cubicle or office walls for our boss or peers to review, without worrying about outcomes, or the possible interpretations.

Being on the front lines every day the Juice Team is witnessing an evolution of the modern-day data analyst.   Producing static reports, hitting the email send button, and answering periodic questions doesn’t work anymore.

The really impressive “analysts” we speak with now do much more than analyze data and produce reports.   So much more that we’ve taken to calling them "data presenters". There’s probably a much better name, but it seems to be the one that has stuck.

What are the attributes of a data presenter? Well, on top of being an Excel guru, pretty savvy with Tableau and not bad with SAS or R you probably have some combination of the following traits:

  • You know your data and business inside and out.
  • You care about your data being understood.
  • You need to influence or explain your data to a non-analytical audience.
  • You want your data to be viral.  You want your initial audience to share the work you’ve done with others.
  • You realize it’s not about you or your data. It is about the bigger picture, i.e. making your team, project or company successful. It's about the person who will be "receiving" the result.

Another observation that may help is that data presenters generally are not created overnight.  They tend to emerge over time.  And over time we’ll be watching, because after all, we’re striving to be better data presenters, too.

Guest Post: The To Do List

We met Raleigh Gresham recently at Atlanta Product Camp and immediately found a data kinship. We especially loved one of his blog posts on To Do Lists and got permission to post it here on the Juice blog. You can check out his post below and other writings here.

------------------------------------------------------------------------------

To-do list

To do lists. The pinnacle translation of any data set. The final act of simplification for any analysis.

They are reports in their most primal state. They achieve the ultimate goal of any applied datum, answering the core question “what do we do now?”

For the rare data user hoping to generate utility from their analytical efforts, this simplest of reports is worth fighting and editing for. They demand data isolate the next actions. Ignoring the excuses of technology and governance that are liberally used by so many in their field, they relentlessly “sculpt” the data with analytics until the simplicity of checkboxes is all that’s left.

When this data dharma is finally achieved, they are done. They add nothing more. They make no apologies for the simplicity or the unfamiliar clarity of the result.  A to do list leaves no room for the theory-making and hypothesis-spinning rendered by common reports. There is no buffer for interpretation. The comforts of second guessing dissolve. Someone becomes accountable for action.

To do lists are ruthlessly challenging to achieve. Most analysts do not have the stomach for them. To create to do lists, one must be willing to call action out — to recommend movement. Action is risky. Movement changes the status quo. It takes great resolve to settle for nothing less than a to do list.

Guest Post: "All Data is Local"

We are excited to offer you this “Guest Post” by Sam Zamarripa of The Essential Economy Council. In this thoughtful post, Sam reminds us that data is everywhere - including politics. He also reminds us through a real-life example where our focus should be before we start to unload all of the knowledge, information, and data we possess.

----------

If you’ve paid close attention to the politics of the last 15 or 20 years, you may have heard the expression, “all politics is local”. This expression was originally coined by Tip O'Neill, former Speaker of the House in the U.S. Congress. This phrase refers to the specific kitchen table topics that are most relevant in each district. It is about addressing what each person in the district truly cares about instead of harping about big, global, and intangible ideas. This phrase is so pertinent at the Essential Economy Council, we are now starting to say that “all data is local” too!

At The Essential Economy, we realized that all of our printed materials and discussions needed to be grounded very solidly to the local district and their specific areas of responsibility — to their local politics. Sure, an overall average or total might be considered an interesting factoid, but we’ve proven that they’re much more engaged when our content is specific to them, or better yet, to their constituents, resulting in a much higher likelihood that they will take action.

“The Essential Economy” in its simplest form refers to that portion of our economy that includes restaurant kitchen staff, janitors, landscape crews, farm workers, nursing aides, stock clerks and other non-managerial positions. The cluster spans six major economic sectors from agriculture and construction to hospitality and personal care. Workers in The Essential Economy have traditionally been described as low wage and unskilled, but without whom, core and necessary components of our economy would collapse (anyone out there like to have their trash collected on a regular basis?). In Georgia, one in four workers belong to this part of our economy.

In 2012, we were asked by these industry leaders to understand the impact their workforce had on the overall economy. As a result of these initial discussions, the Essential Economy Council was created. With the help of Alfie Meeks, PhD Economist, of Georgia Tech. We compiled data from the Georgia Dept of Labor on 86 job classifications.

Essential Economy jobs in Georgia

Summary of key findings:

  • 12% of Geogia’s GDP
  • Generates $114M in sales taxes
  • 25% of all jobs in Georgia
  • Average wage: $21,718
  • Consistently present in all Georgia counties, from wealthiest (Fulton, 22% of workers) to poorest (Quitman, 24%)

This overall data is great to have in our hip pocket and it continually surprises folks. However, when we presented this same state-wide data to Georgia Speaker of the House David Ralston his first response was “so what?” That was the response we needed to hear. When we modified our approach and proceeded to show him the data for the counties in his district, his reaction changed. He immediately asked pertinent follow-up questions such as "How have the Gilmer County numbers changed over the years?" and "How does Gilmer compare to the counties around it?"

Now that we understand this, we offer a more customized approach to each audience we address. We have developed anecdotes about the data. For example, “did you know that Forsyth County has over 1,400 cashier positions”. We are now able to share this information with policymakers, industry and economic development leaders all over Georgia. They seem to appreciate the fact that we realize “all data is local”. We’ve learned it’s OK not to do a full data dump during every meeting or presentation; not only “OK”, but “better.” To accomplish this, we’ve worked with Juice to build several interactive tools to help us communicate our findings in targeted and contextually relevant ways.

Interactive Georgia County Map

As we consider future datasets, growing the Essential Economy beyond Georgia, and contributing more to the national discussions on immigration reform, we continue to believe strongly in the idea that all data is local. As you consider sharing information with your audience and you are looking for more action than "so what", "that's interesting" or "thanks for sharing" responses, think of this post and remember to "localize" the data for your target.

The Essential Economy Council is a bipartisan, nonprofit 501(c)(3) organization that originates research and communications that are used to educate elected officials and business leaders on the value of Georgia’s Essential Economy. The Council is managed by a board of industry specialists and professionals, and it partners with leading businesses, economic development organizations and academic institutions to design and execute its research and communications. If you'd like to know more about the Essential Economy and the work we're doing you can visit our website or follow us on twitter @EssentialEcon.

Guest Post: Did You Answer the Question?

Earlier in the week Ken and I were discussing the importance of asking the right question and the very next day Kathy's blog post showed up so I had to share it.  If you're not familar with Kathy, she and the team at Rowell & Associates are talented healthcare experts that share our passion for the effective visual display and sharing of information.  In addition to her unique combination healthcare knowledge and data visualization, she is very funny.  In the spirit of full disclosure it is very hard for a Yankee Fan (me) to compliment a Red Sox Fan like Kathy; however Kathy is the exception.  Enjoy her post and if you're in healthcare check out her site. My husband Bret and I had a lively exchange the other morning about the previous night's Red Sox game. I'd gone to bed while he stayed up late watching the last few innings, so when I woke up, the first thing I asked was, "Who won?"

My question stimulated the following exchange:

"The Red Sox lost." "I didn't ask you who lost. I asked you who won." "It's the same thing." "No, it isn't." "Fine. The Los Angeles A's won. Now run far, far away, and leave me alone."

Most of this constitutes marital sport in my house, but part of the friction stems from real human frailty to which we all fall prey occasionally. Perhaps we fail to listen to or clarify the question at hand, and as a result answer incorrectly or ineffectively. We might think we know far better than the other person what (s)he really wanted to ask; so we answer that question ("Who lost the game?") instead of the one that was actually spoken ("Who won?").

The banter with Bret about the precise nature of my baseball question was inconsequential (especially since it occurred before my first cup of coffee). Our efforts to communicate healthcare data accurately and effectively are anything but. Here's what I mean.

My colleague Janet and I have had an ongoing conversation about the data and other information on PatientCareLink (PCL). We have been exploring its site, especially the section on hospital staffing plans, and we keep circling back to this: what question does the information shown answer?

First, we reviewed PCL's Mission Statement: "To deliver transparent quality and safety information from hospitals and home care agencies to patients and other healthcare stakeholders." Since this gave us a clear idea of what the group was trying to accomplish, we let it guide us as we reviewed the site and sought to answer one crucial question: do PCL data and information as they are currently displayed tell patients precisely how safe the hospitals and home health agencies listed are, and what quality of care each provides?

Here's one -- very revealing -- example of what we found.

We looked at Cooley Dickinson Hospital's Adult Surgical Orthopedic Unit Nurse Staffing Plan for 2012 compared to the actual nursing staff levels during that year, trying to answer this question: could we tell, by comparing the Plan and actual nursing levels for the year, if this Unit provided high-quality, safe care to Orthopedic patients?

Cooley Dickinson Hospital's Adult Surgical Orthopedic Unit Nurse Staffing Plan for 2012

We could not. The most we could decipher from this graphic was that the intended complement for the unit was 11 nurses, and that most days there were actually about 10. The following drilldown seems to explain this variance:

Drilldown
Drilldown

This tells us the reason for the staffing variation (although we don't know why staffing hours from 2006 are referred to here) -- but it still doesn't answer our core question. Are ten nurses enough to ensure safety and high-quality orthopedic care? And what defines such care for this patient population, anyway?

We kept digging, zeroing in on this hospital's Fall Rate for the time frame closest to (though not precisely congruent with) the Staffing Plan data. (Please disregard the 3-D display: the folks who designed it haven't come to my workshops or read my newsletters yet.)

Fall Rates
Fall Rates

Aside from the different time frames noted above, Unit Types are not aligned with those reported in the Staffing Plan. After careful examination of the data, and although we have approximately 50 years of industry experience between us, Janet and I could not say for sure whether any of the falls on the Adult Surgical Unit (3) and the Adult Med-Surg Combined (53) involved orthopedic patients. Some of them may have, but that is only a guess.

Stay with me just a bit longer: it gets more interesting.

Hospitals whose data are displayed on the PCL site can if they wish enhance their presentations via a written narrative. Here is part of what this hospital submitted: "Cooley Dickinson has been ranked in the top 5 percent of all U.S. hospitals in patient safety by HealthGrades®, the country's leading independent health care ratings organization, for three consecutive years. HealthGrades® has also recently named Cooley Dickinson #1 in Massachusetts for joint replacement outcomes."

By this stage of the game Janet and I were mentally exhausted from combing the site for useful data (and desperately in need of a good cocktail). We had begun by asking one apparently simple question, then set out to answer it: could PCL's data and information tell us how safe and how good the care provided by its member hospitals and home health agencies was?

Nothing PCL offered even came close to answering this simple, vital question. At best, we could see data posted by certain healthcare institutions, and read what they had to say about that information; but our question -- created with the guidance of PCL's own Mission Statement -- was (and remains) unanswered, indeed unaddressed.

Here's the point: data and information are helpful only to the extent that they answer the questions that people actually ask -- not the ones you think they should have asked. This means that the data you gather, analyze, and display must be designed and presented with those questions constantly in mind, using symbols and words that make the answers crystal-clear and unequivocal: no jargon to baffle, no fancy graphics to befuddle.

Janet is working on a bit of a re-design of this information, so stay tuned. Me? I'm working on new ways to annoy my husband -- just for love of the game.

Design versus Engineering

EXAGON FURTIVE EGT

One of my favorite journalists is Dan Neil who writes the weekly car review for the Wall Street Journal. His combination of wit and snark, with just a touch of 'finicky' speaks right to me.

Recently, Dan was reviewing the Mazda6 and made this observation:

"Among the many injustices in the car business is styling. A company can build an automobile with great performance, efficiency, value, safety, and back it up with pitch-perfect messaging, only to have whole enterprise come up short because of one awkward swage line, one not-quite-there proportion, or—famously, notoriously, in the recent case of Mazda—a weird, zany grille."

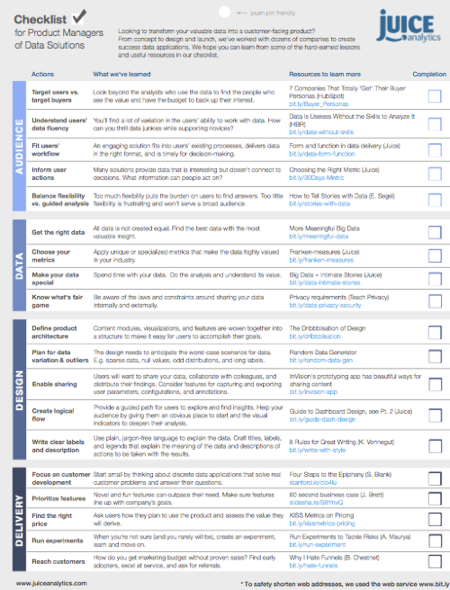
And you know what? It's not too different for an application designed to present data. Sometimes the most applicable, most descriptive, most complete, most highly-engineered data gets panned because the front-end display was not properly designed, styled, and presented.

In reflecting on this situation, Dan goes on to say:

"It almost seems immoral, doesn't it, that the work of all those great engineers is subject to the whim of some "stylist"? What kind of job is that, anyway? Styling is so trivial, so nonessential, so artsy-tartsy. Powertrain, noise-vibration-harshness, chassis dynamics—those are hard. You can do styling on a cocktail napkin."

Ha! "Artsy-tartsy!" Well, as Dan goes on to say, design isn't quite as easy as "styling on a cocktail napkin" and it takes both design and engineering to create a wonderful automotive experience. And, I'd add, a wonderful solution to data problems.

So, what's the key?

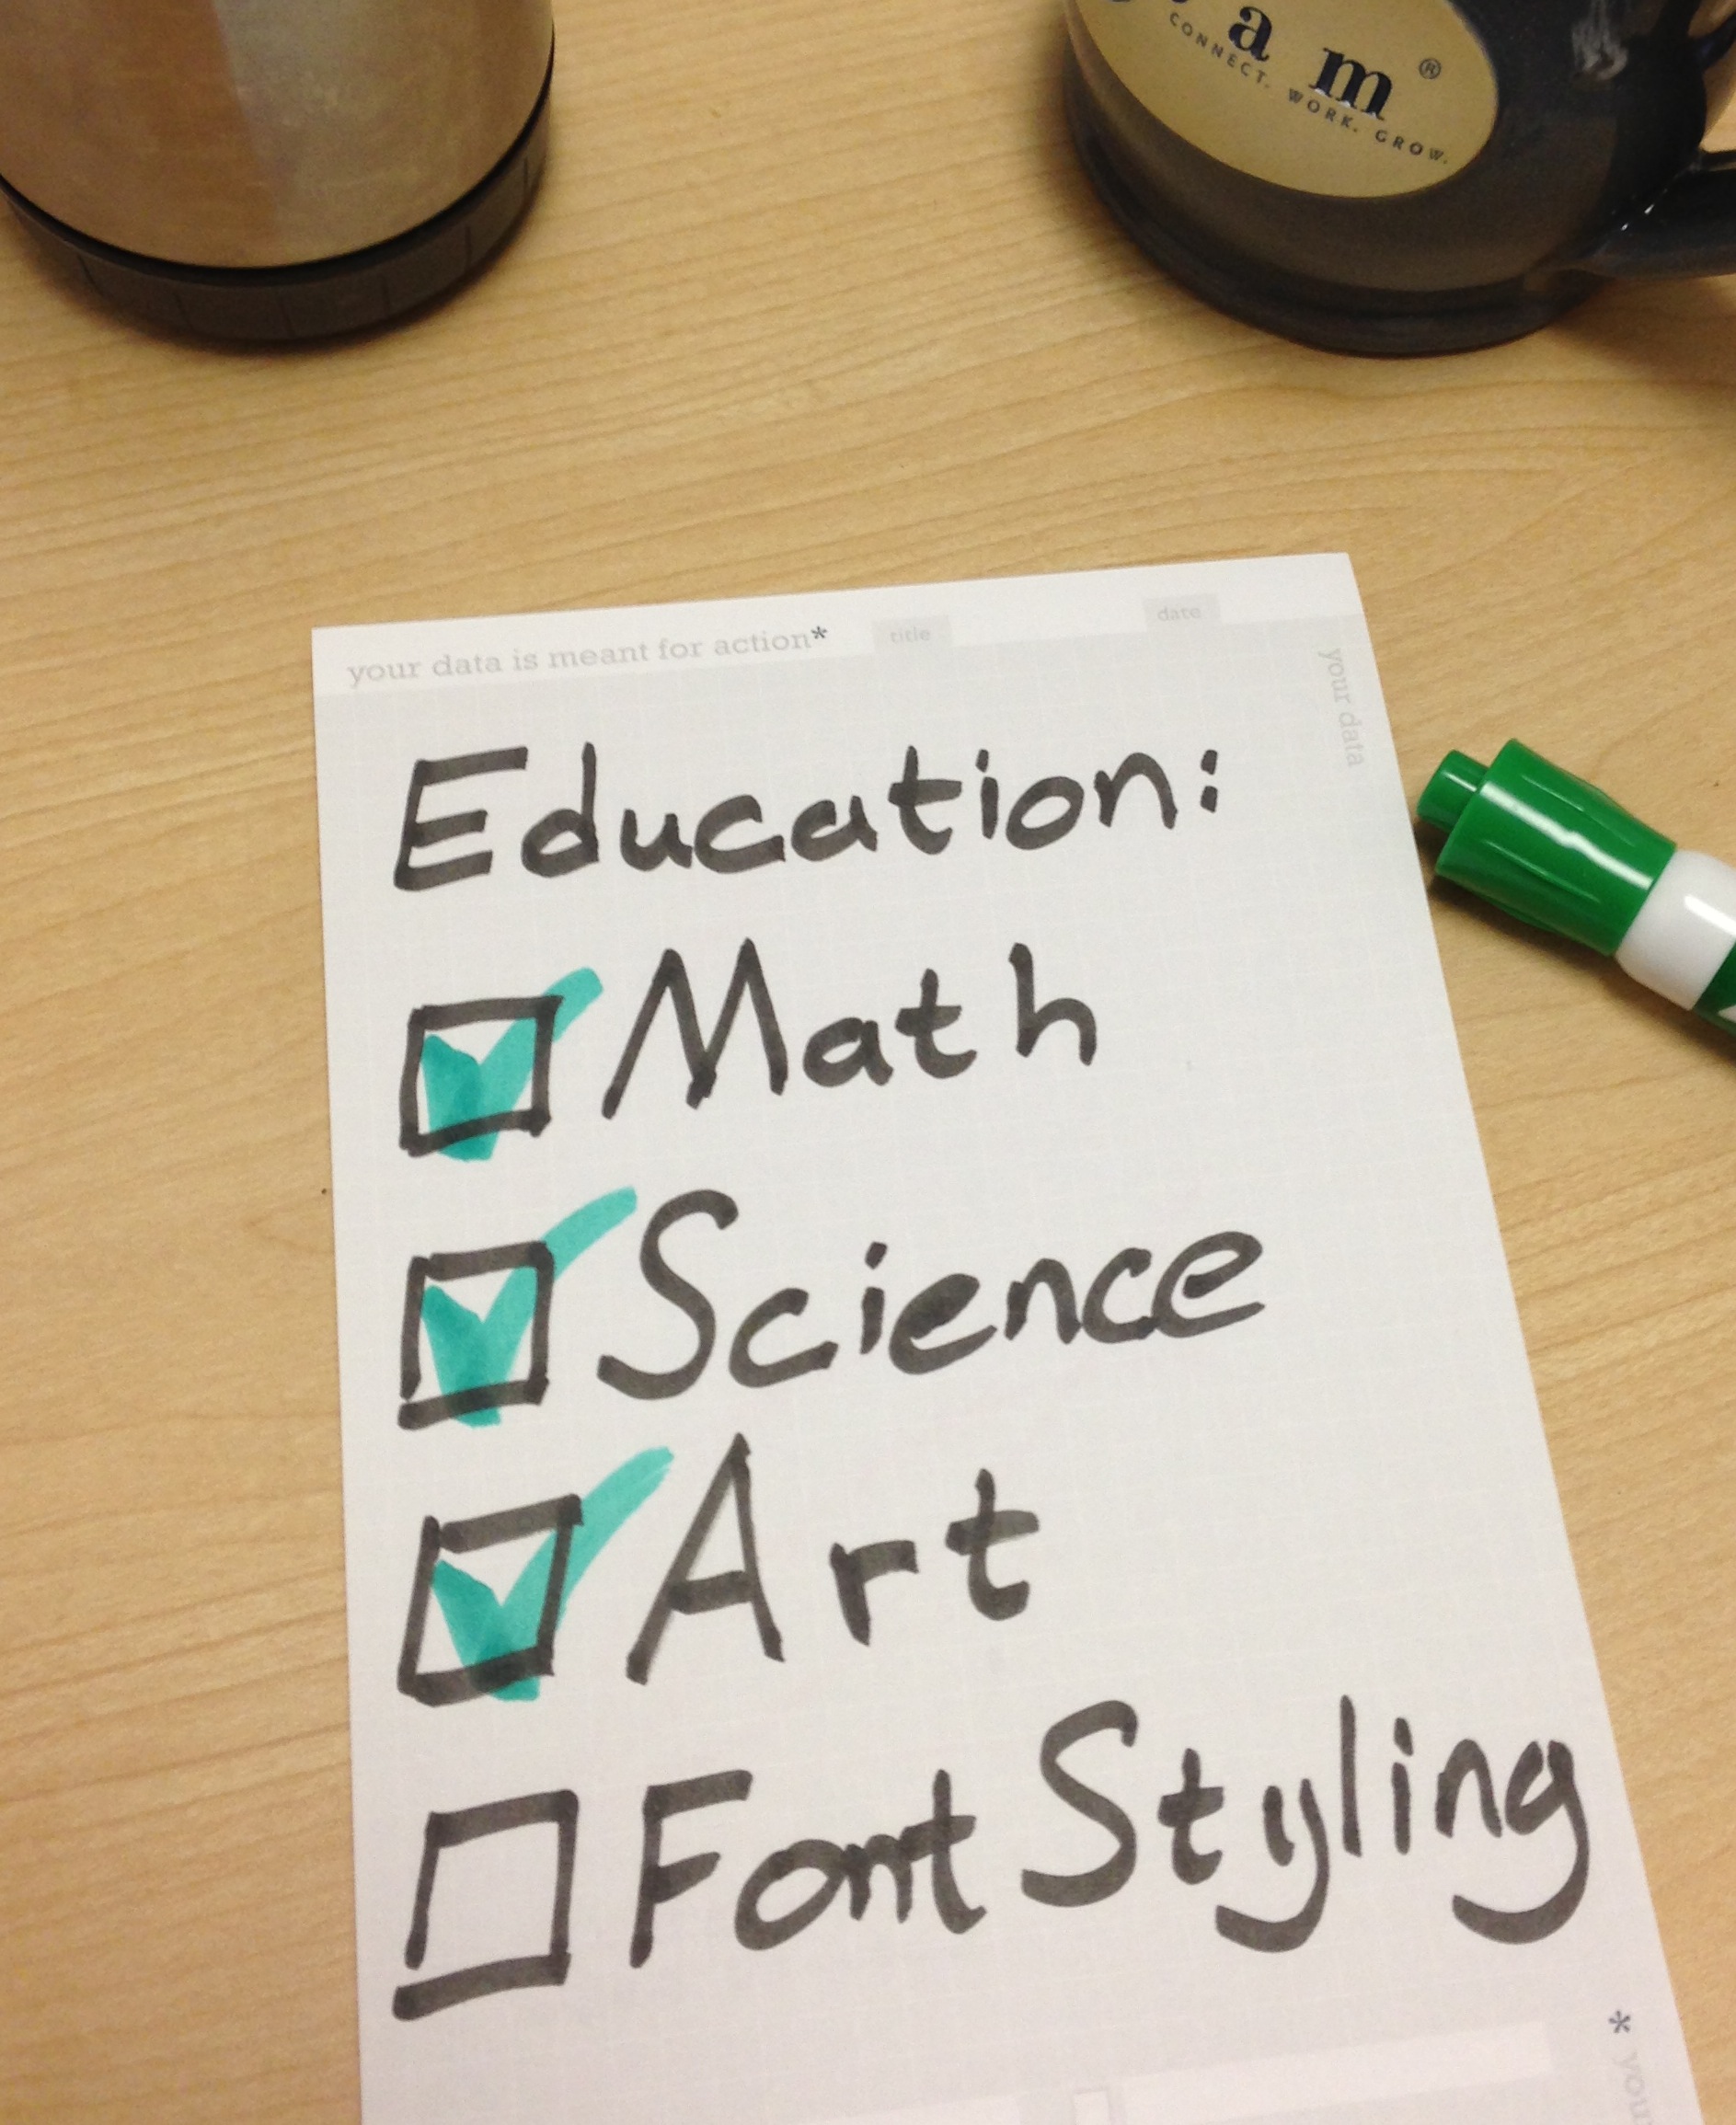
You want your users to buy the styling and be thrilled with its engineering awesomeness.

After doing his typical in depth, car-nerd-level review, talking about design philosophy, a-pillars, compression ratio, and suspension tuning, he reveals the winner of this designer/engineer throw down:

"So who won, the stylists or the engineers? Well, the Mazda6 is a great, efficient, fun-to-drive machine in a field of machines that can be described likewise. What people will buy is the styling.

Which is to say, the engineers won."

Be a winner -- design your data applications so your target users will buy them. And give them the opportunity to adore your engineering.

Google Reader: Looking for options?

Dang! When Google announced in March that they were going to sunset Google Reader, we wanted to believe that if we ignored the announcement, it wouldn't happen. But alas, our strategy didn't work. In case you haven't been paying attention, Google Reader won't be available after July 1st... this coming Monday. So, if you're a Reader user, the blogs you follow (like Juice's) won't be brought to you with the reliable regularity you've come to know and love since 2005 (yep, we started our blog right about the same time Reader made its debut).

But never fear! Here is a link to a list of Google Reader alternatives that will let you import your Google selections directly into a new reader.  But (and here's the part where you need to pay attention), you've got to sign up with one of them before June 30th to ensure this happens.

Afraid of commitment? Too soon to start a new relationship with a new reader you just picked up on the internet? Or maybe you're not sure because you have almost a whole week left. Well, if any of those describe you, you can follow us on Twitter, LinkedIn or Google+.  We post links to our updates in those places as well.

Here's to many more years of happy reading!