
Create Professional-Grade Marketing Dashboards and Reports
🤩 Impress clients by delivering beautifully-designed interactive web experiences
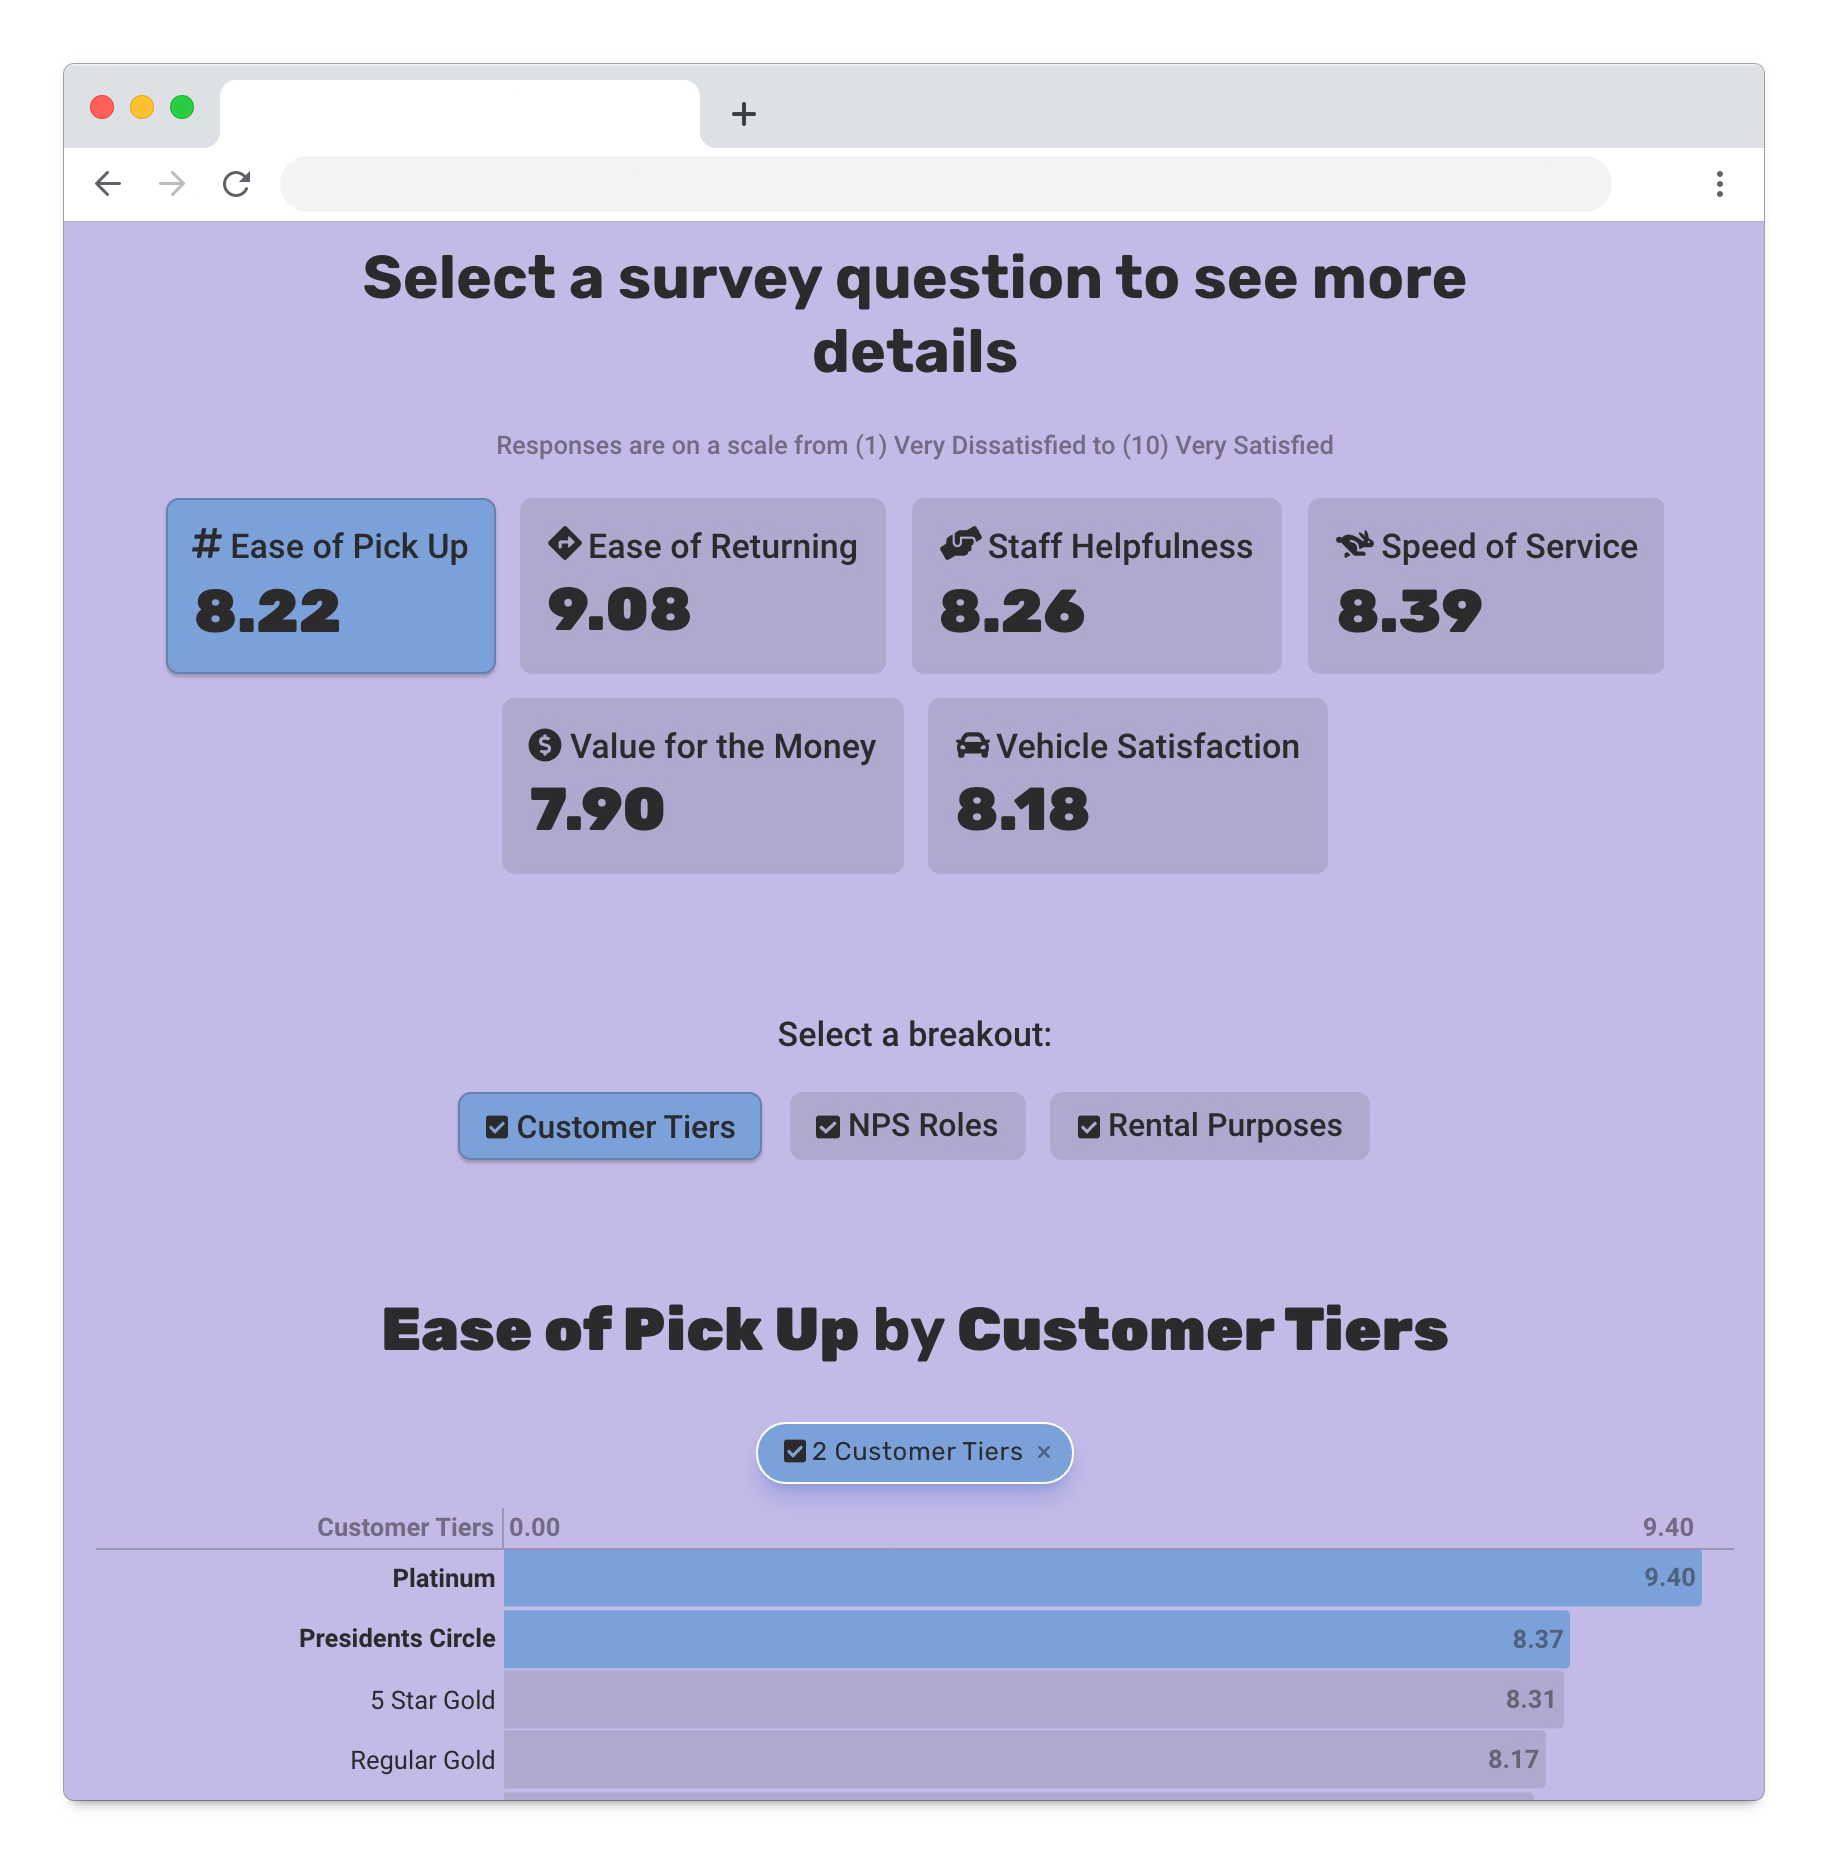
👉 Guide clients by combining data visualization with highlights and insights
📝 Control the message by defining exactly what data to show
⏱Save time with easy data updating and templates to support your entire client base


Simple to get started. 14-day free trial. Let us prove it to you.
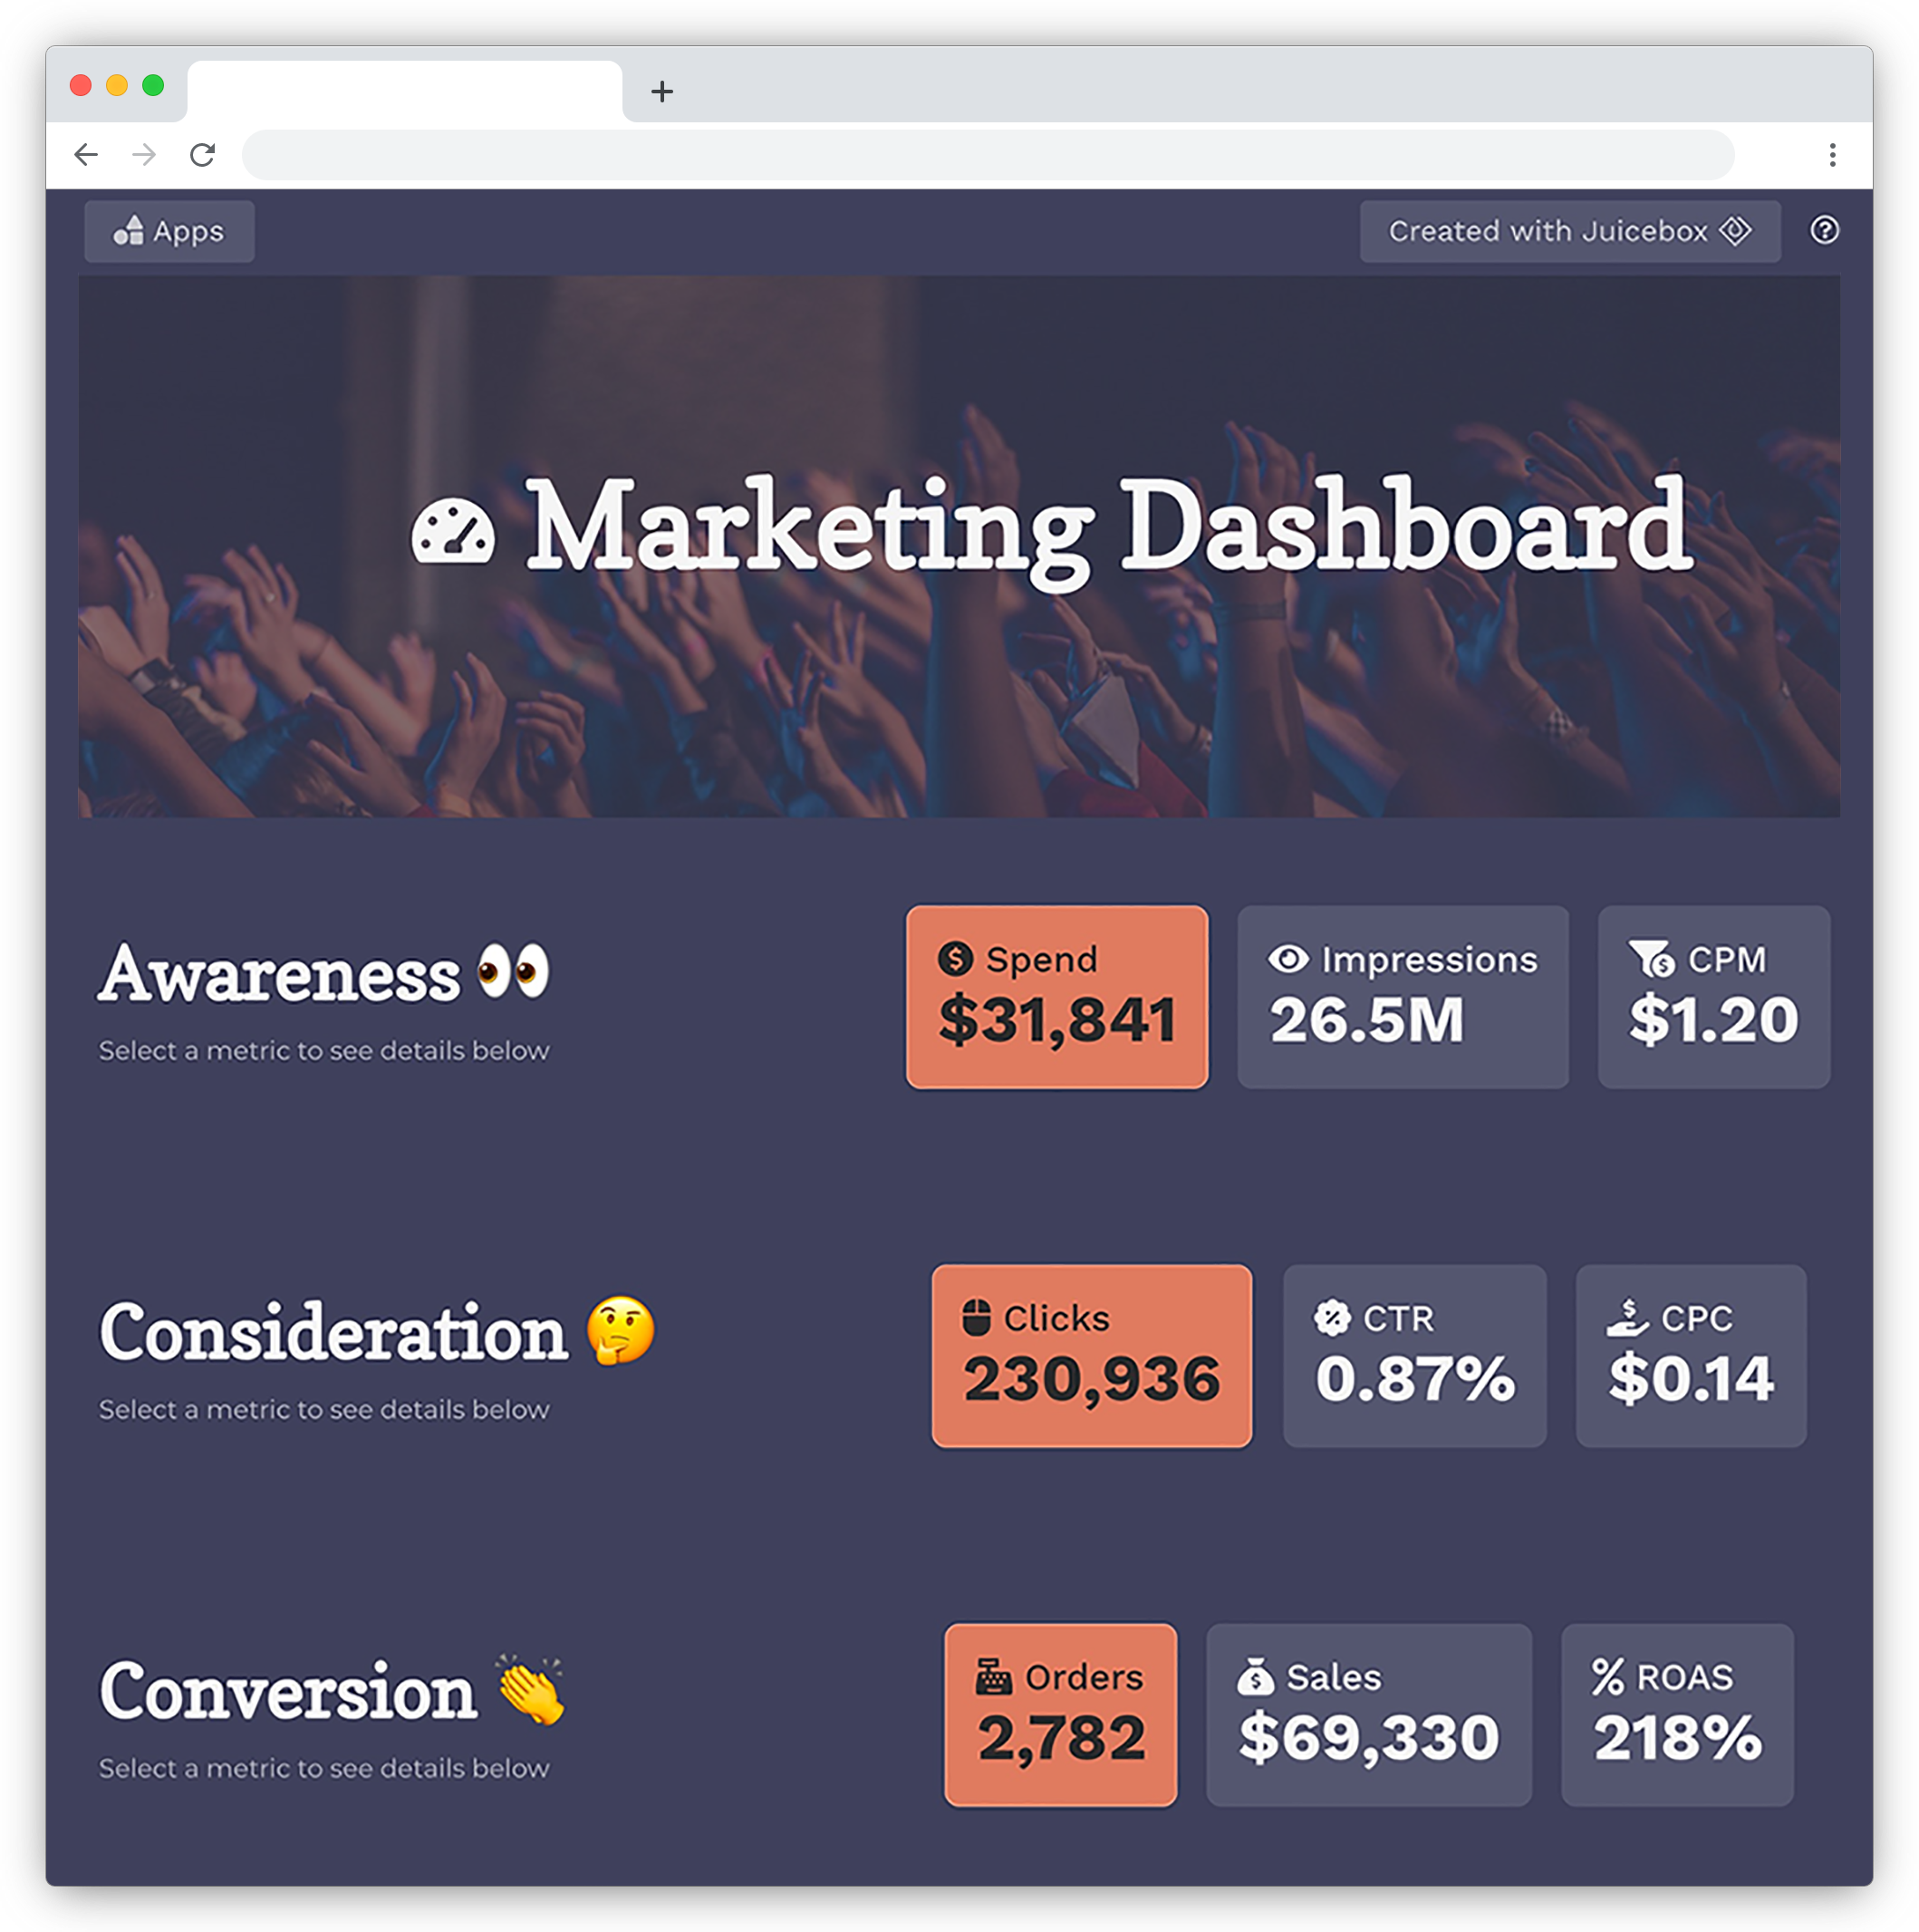
(1) Use our pre-build marketing dashboard to get started in minutes

(2) Update with your client’s data using our default spreadsheet template

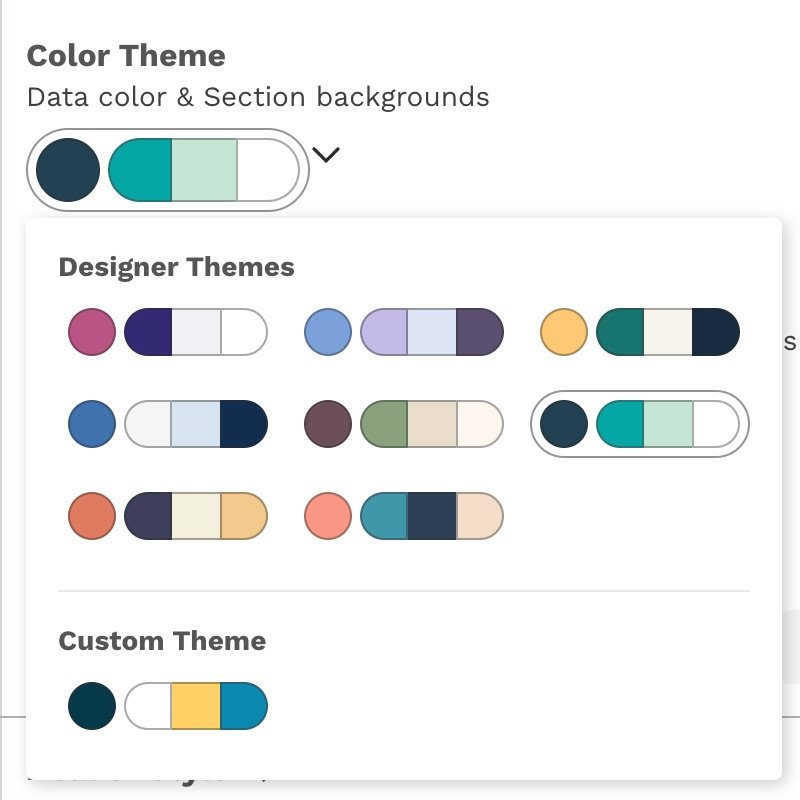
(3) Customize your Juicebox report or dashboard with logos, colors, and styling
Thousands of companies have signed up to use Juicebox for their data visualization needs

Our customers love how Juicebox combines easy of use with powerful outcomes:
“Juicebox has allowed our team to distill otherwise unwieldy data for our clients into consistent, reliable, and actionable insights.”
“This is a cutting edge data analytic tool, bridging infographics with staid corporate dashboards to create a new narrative around data culture and fluency.”
“I love Juicebox’s ability to communicate my data-driven message to audiences inside and outside my team. Easy to get started and delivers a clear, step-by-step process from data to visualization.”
“It is extremely easy to create an amazing narrative with data I have in CSV files. I can share this with anyone who would benefit from my data. No coding required.”
A modern data visualization solution
No other data visualization tool combines data storytelling, ease-of-use, and powerful analytical features.
🧭 Dynamic narratives to guide your audience to insights. Juicebox enables drill-down analysis and interactive data exploration automatically.

🎨 Built-in design so your data always looks professional. Now you can make beautiful apps that will impress your audience.

🌠Combining images, narrative text, and interactive visualizations delivers a complete data storytelling experience — not a collection of charts.

🏎Powerful features for data querying puts Juicebox light-years beyond the limitations of traditional data presentation and graphics tools.

More questions? We’ve got answers.
How much does it cost?
We offer a 14-day trial to check out all the features in Juicebox. Our subscription plan is $15/month per editor. See our subscription pricing.
How does it compare to visual analytics platforms like Tableau, PowerBI, or Qlik?
Those are powerful visual analytics tools for dedicated data analysts. But what about the rest of us? Juicebox focuses on explanatory data presentation over exploratory analysis. And you don’t need a training course or certification to present data in powerful new ways.
What skills do I need to be successful?
If you are comfortable working with Excel and Pivot Tables, you’ll pick up Juicebox with ease. As a tool for data visualization and analysis, it helps to understand flat data tables and the difference between measures and dimensions. You do not need any coding skills or to be a designer. We’ve taken care of those parts.
How do I connect my data?
You can either upload data as CSV files or connect directly to a database. Juicebox is great for slicing-and-dicing data, so you’ll want flat data tables (like you’d use for an Excel PivotTable)
Can I get extra help?
We’ve got you covered with an excellent customer success team, video tutorials, and a thorough Help Center. And if you want a jump-start, our design services team can help with everything from preparing data to designing your first app.
Where do I learn more?
Check out our tutorials, help articles, and examples.